File:De Finetti diagram.svg

Original file (SVG file, nominally 500 × 500 pixels, file size: 14 KB)
Captions
Captions
Summary
[edit]
| Description |
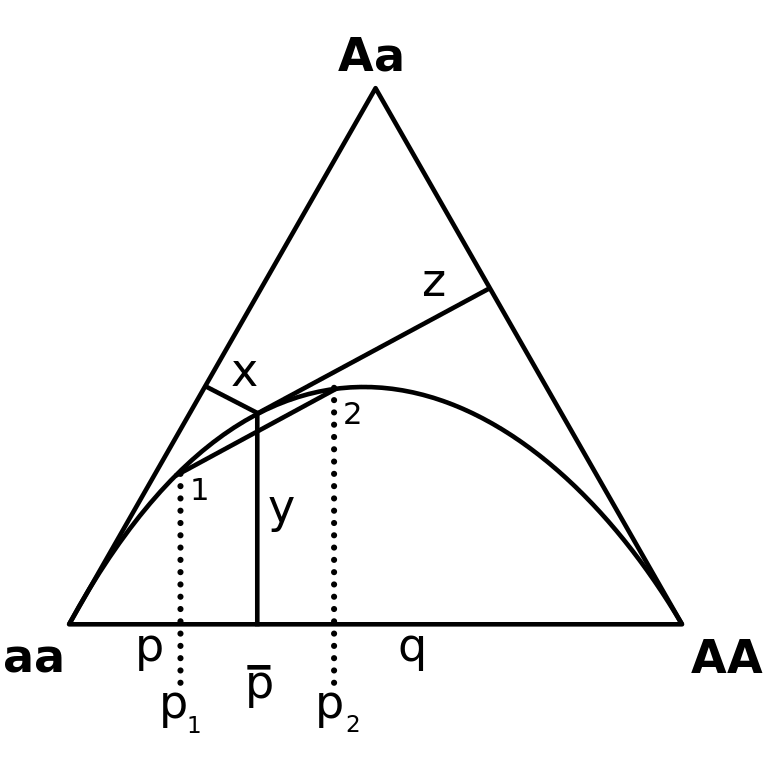
A De Finetti diagram illustrating the Wahlund effect. Genotype frequencies are given by the edge distances x (for AA), y (Aa) and z (aa). Allele frequencies p and q = 1 - p are determined by the horizontal displacement along the bottom edge connecting aa and AA, scaled by constant factor (1/2)sqrt(3) (the ratio between the height and the base of an equilateral triangle). Also p = x + y/2 and q = y/2 + z. The curved line are the Hardy–Weinberg equilibrium genotype frequencies; points 1 and 2 denote two populations in equilibrium. The genotype frequencies of the combined population are a weighted mean of the subpopulation frequencies, corresponding to a point somewhere on the solid line connecting 1 and 2. This point always has a lower heterozygosity (y value) than the corresponding (in allele frequency p) Hardy-Weinberg equilibrium. |
| Source | File:De finetti diagram.png |
| Author |
SVG: Beao 02:40, 14 November 2009 (UTC) Original raster: אמר Steve Caruso (poll) 23:56, 24 June 2006 (UTC) |
Licensing
[edit]
- You are free:
- to share – to copy, distribute and transmit the work
- to remix – to adapt the work
- Under the following conditions:
- attribution – You must give appropriate credit, provide a link to the license, and indicate if changes were made. You may do so in any reasonable manner, but not in any way that suggests the licensor endorses you or your use.
- share alike – If you remix, transform, or build upon the material, you must distribute your contributions under the same or compatible license as the original.
File history
Click on a date/time to view the file as it appeared at that time.
| Date/Time | Thumbnail | Dimensions | User | Comment | |
|---|---|---|---|---|---|
| current | 02:44, 14 November 2009 | | 500 × 500 (14 KB) | Beao (talk | contribs) | White background and 1:s. |
| 02:40, 14 November 2009 |  | 500 × 500 (20 KB) | Beao (talk | contribs) | {{Information |Description=De Finetti diagram. |Source=File:De finetti diagram.png |Date= |Author=SVG:~~~~ Original raster:<small>אמר</small> <tt><b><font color="#0033CC">Steve Caruso</font></b></tt> |
You cannot overwrite this file.
File usage on Commons
There are no pages that use this file.
File usage on other wikis
The following other wikis use this file:
- Usage on en.wikipedia.org
- Usage on fr.wikipedia.org
- Usage on pl.wikipedia.org
- Usage on pt.wikipedia.org