File:Cos 1to1.png
Jump to navigation
Jump to search
No higher resolution available.
Cos_1to1.png (799 × 277 pixels, file size: 8 KB, MIME type: image/png)
Captions
Captions
Add a one-line explanation of what this file represents
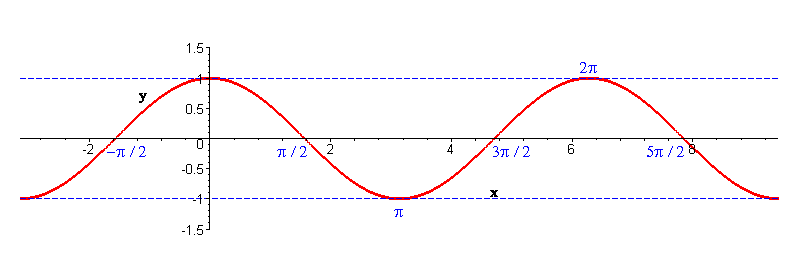
cos(x)
Created with Maple:
plots[display]({plot(cos(x),x=-Pi..3*Pi,y=-1.5..1.5,numpoints=2000,thickness=3,labelfont=[TIMES,BOLD,12]),PLOT(
- TEXT([evalf(-Pi/2),-1.2],"-p / 2"),TEXT([evalf(Pi/2),1.2],"p / 2"),TEXT([evalf(Pi),-0.2],"p"),
- TEXT([evalf(3*Pi/2)+0.3,-0.2],"3p / 2"),TEXT([evalf(2*Pi),1.2],"2p"),TEXT([evalf(5*Pi/2)-0.3,-0.2],"5p / 2"),
- CURVES([[-evalf(Pi),1],[evalf(3*Pi),1]]),CURVES([[-evalf(Pi),-1],[evalf(3*Pi),-1]]),
- FONT(SYMBOL,12),LINESTYLE(3),COLOR(RGB, 0, 0, 1))},scaling=CONSTRAINED);
Author: FredStober

|
This math image could be re-created using vector graphics as an SVG file. This has several advantages; see Commons:Media for cleanup for more information. If an SVG form of this image is available, please upload it and afterwards replace this template with
{{vector version available|new image name}}.
It is recommended to name the SVG file “Cos 1to1.svg”—then the template Vector version available (or Vva) does not need the new image name parameter. |
| This work has been released into the public domain by its author, FredStober. This applies worldwide. In some countries this may not be legally possible; if so: |
File history
Click on a date/time to view the file as it appeared at that time.
| Date/Time | Thumbnail | Dimensions | User | Comment | |
|---|---|---|---|---|---|
| current | 17:23, 17 January 2006 | 799 × 277 (8 KB) | Fred Stober (talk | contribs) | ||
| 21:22, 14 September 2005 | 741 × 256 (7 KB) | Fred Stober (talk | contribs) | |||
| 23:30, 13 September 2005 | 746 × 238 (6 KB) | Fred Stober (talk | contribs) | cos(x) Created with Maple: plots[display]({plot(cos(x),x=-2*Pi..4*Pi,y=-1.2..1.2,numpoints=2000),PLOT(CURVES([[-7, 1], [13, 1]]),CURVES([[-7, -1],[13,-1]]),LINESTYLE(3),COLOR(RGB, 0, 0, 1))},scaling=CONSTRAINED); Author: FredStober { |
You cannot overwrite this file.
File usage on Commons
There are no pages that use this file.
File usage on other wikis
The following other wikis use this file:
- Usage on de.wikipedia.org