File:Cobweb theory (convergent).svg
Jump to navigation
Jump to search

Size of this PNG preview of this SVG file: 500 × 500 pixels. Other resolutions: 240 × 240 pixels | 480 × 480 pixels | 768 × 768 pixels | 1,024 × 1,024 pixels | 2,048 × 2,048 pixels.
Original file (SVG file, nominally 500 × 500 pixels, file size: 3 KB)
Captions
Captions
Add a one-line explanation of what this file represents
| Description |
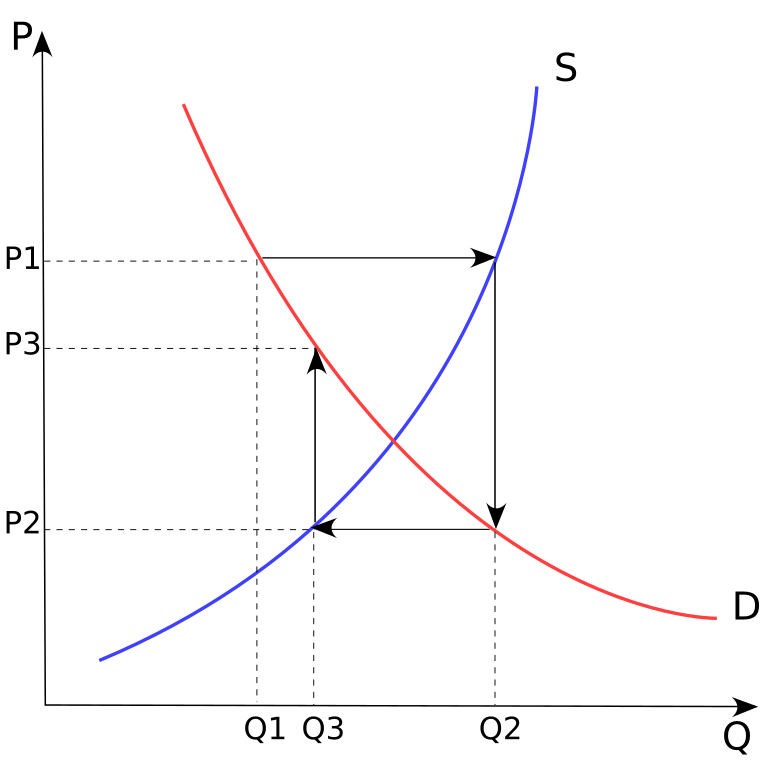
English: A graph illustrating the cobweb model of price (and quantity) fluctuation. The case shown is the convergent case of increasing stability in the market.
Deutsch: Der Fall gedämpfter Schwankungen im Spinnwebtheorem: P=Preis, Q=Produktionsmenge (Quantity), S=Angebot (Supply), D=Nachfrage (Demand). |
| Date | (UTC) |
| Source | |
| Author |
|
| Other versions |
.svg) |
This file is licensed under the Creative Commons Attribution-Share Alike 3.0 Unported license.
- You are free:
- to share – to copy, distribute and transmit the work
- to remix – to adapt the work
- Under the following conditions:
- attribution – You must give appropriate credit, provide a link to the license, and indicate if changes were made. You may do so in any reasonable manner, but not in any way that suggests the licensor endorses you or your use.
- share alike – If you remix, transform, or build upon the material, you must distribute your contributions under the same or compatible license as the original.
Original upload log
[edit].svg&action=edit§ion=1)
This image is a derivative work of the following images:
- File:Cobweb_theory.png licensed with Cc-by-sa-3.0,2.5,2.0,1.0, GFDL
- 2010-11-11T22:29:08Z File Upload Bot (Magnus Manske) 640x599 (47952 Bytes) {{BotMoveToCommons|en.wikipedia|year={{subst:CURRENTYEAR}}|month={{subst:CURRENTMONTHNAME}}|day={{subst:CURRENTDAY}}}} {{Information |Description={{en|Cobweb model (economics): image created by user Rinconsoleao under GNU FD
- File:Supply-and-demand.svg licensed with Cc-by-sa-2.5,2.0,1.0, Cc-by-sa-3.0-migrated, GFDL
- 2006-04-29T17:48:53Z Faxe 500x500 (13094 Bytes) [[Image:Supply-and-demand.svg|thumb]] == Opis == {{en|Supply and Demand}} * P - price * Q - quantity of good * S - supply * D - demand * author: Paweł Zdziarski (faxe) * created with [[:en:Inkscape]] {{pl|Popyt i podaż}
- 2006-04-29T17:38:06Z Faxe 500x500 (13096 Bytes) == Opis == {{en|Supply and Demand}} * author: Paweł Zdziarski (faxe) * created with [[:en:Inkscape]] {{pl|Popyt i podaż}} * autor: Paweł Zdziarski (faxe) * stworzone w [[:pl:Inkscape]] [[Category:Economics diagrams]]
- 2006-04-29T17:20:56Z Faxe 500x500 (9478 Bytes) {{en|Supply and Demand}} * author: Paweł Zdziarski (faxe) * created with [[:en:Inkscape]] {{pl|Popyt i podaż}} * autor: Paweł Zdziarski (faxe) * stworzone w [[:pl:Inkscape]] [[Category:Economics diagrams]]
Uploaded with derivativeFX
File history
Click on a date/time to view the file as it appeared at that time.
| Date/Time | Thumbnail | Dimensions | User | Comment | |
|---|---|---|---|---|---|
| current | 12:32, 21 January 2011 | | 500 × 500 (3 KB) | Jarry1250 (talk | contribs) | Fix label |
| 18:06, 20 January 2011 |  | 500 × 500 (3 KB) | Jarry1250 (talk | contribs) | Update to improve labelling and accuracy | |
| 22:40, 11 November 2010 |  | 500 × 500 (4 KB) | Jarry1250 (talk | contribs) | Tweak (move "Q" label). | |
| 22:38, 11 November 2010 |  | 500 × 500 (4 KB) | Jarry1250 (talk | contribs) | {{Information |Description={{en|A graph illustrating the cobweb model of price (and quantity) fluctuation. The case shown is the convergent case of increasing stability in the market. }} |Source=*[[:File:Cobweb_theory.png| |
You cannot overwrite this file.
File usage on Commons
The following 3 pages use this file:
File usage on other wikis
The following other wikis use this file:
- Usage on ar.wikipedia.org
- Usage on as.wikipedia.org
- Usage on de.wikipedia.org
- Usage on en.wikipedia.org
- Usage on fr.wikipedia.org
- Usage on he.wikipedia.org
- Usage on io.wikipedia.org
- Usage on it.wikipedia.org
- Usage on pt.wikipedia.org
.svg&oldid=862897048)