File:Climatic impacts by year after different nuclear war soot injections.webp
Jump to navigation
Jump to search

Size of this PNG preview of this WEBP file: 584 × 599 pixels. Other resolutions: 234 × 240 pixels | 468 × 480 pixels | 749 × 768 pixels | 998 × 1,024 pixels | 1,889 × 1,938 pixels.
Original file (1,889 × 1,938 pixels, file size: 320 KB, MIME type: image/webp)
Captions
Captions
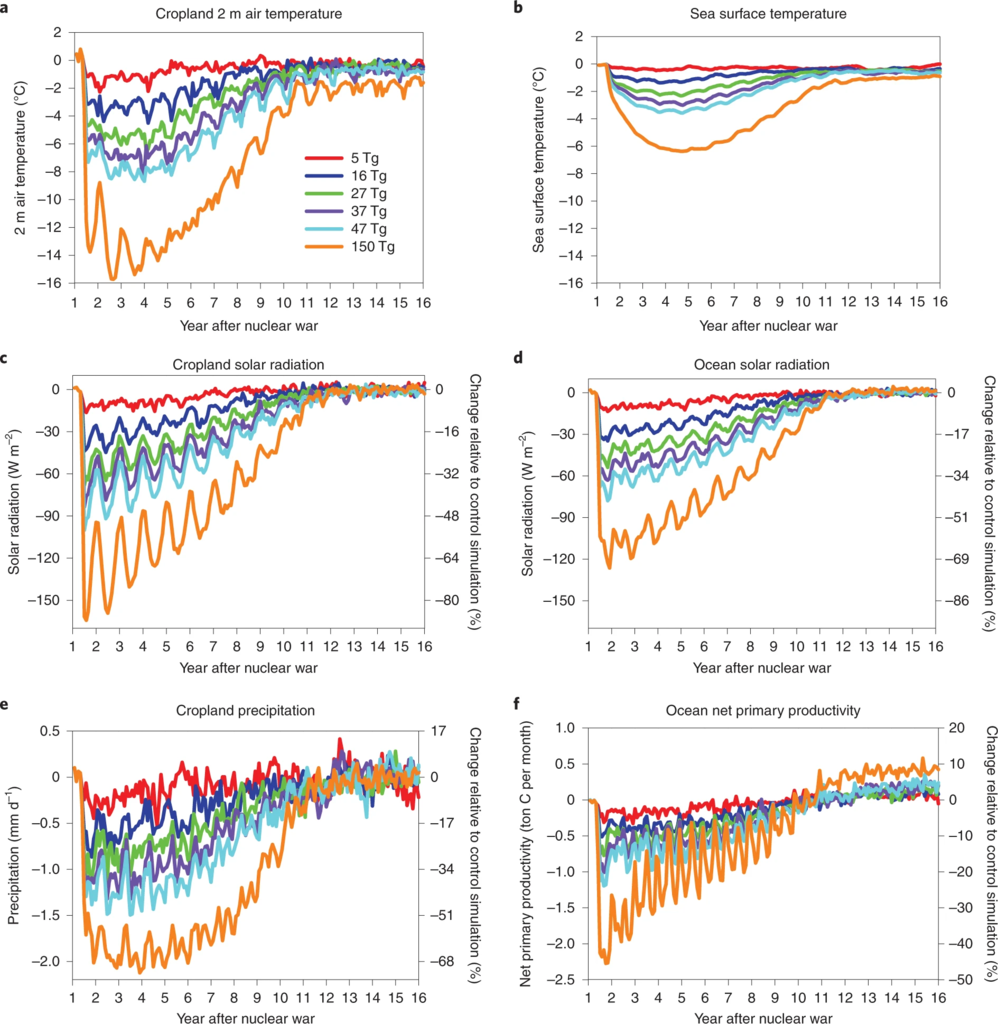
From the study "Global food insecurity and famine from reduced crop, marine fishery and livestock production due to climate disruption from nuclear war soot injection"
Summary
[edit]
| Description |
English: "a–f, Changes in surface temperature (a), solar radiation (c) and precipitation (e) averaged over global crop regions of 2000 (Supplementary Fig. 1) and sea surface temperature (b), solar radiation (d) and net primary productivity (f) over the oceans following the six stratospheric soot-loading scenarios studied here for 15 years following a nuclear war, derived from simulations in ref. 18. These variables are the direct climate forcing for the crop and fishery models. The left y axes are the anomalies of monthly climate variables from simulated nuclear war minus the climatology of the control simulation, which is the average of 45 years of simulation. The right y axes are the percentage change relative to the control simulation. The wars take place on 15 May of Year 1, and the year labels are on 1 January of each year. For comparison, during the last Ice Age 20,000 years ago, global average surface temperatures were about 5 °C cooler than present. Ocean temperatures decline less than for crops because of the ocean’s large heat capacity. Ocean solar radiation loss is less than for crops because most ocean is in the Southern Hemisphere, where slightly less smoke is present." |
| Date | |
| Source | https://www.nature.com/articles/s43016-022-00573-0 |
| Author | Authors of the study: Lili Xia, Alan Robock, Kim Scherrer, Cheryl S. Harrison, Benjamin Leon Bodirsky, Isabelle Weindl, Jonas Jägermeyr, Charles G. Bardeen, Owen B. Toon & Ryan Heneghan |
Licensing
[edit]
This file is licensed under the Creative Commons Attribution 4.0 International license.
- You are free:
- to share – to copy, distribute and transmit the work
- to remix – to adapt the work
- Under the following conditions:
- attribution – You must give appropriate credit, provide a link to the license, and indicate if changes were made. You may do so in any reasonable manner, but not in any way that suggests the licensor endorses you or your use.
File history
Click on a date/time to view the file as it appeared at that time.
| Date/Time | Thumbnail | Dimensions | User | Comment | |
|---|---|---|---|---|---|
| current | 14:15, 22 September 2022 | | 1,889 × 1,938 (320 KB) | Prototyperspective (talk | contribs) | Uploaded a work by Authors of the study: Lili Xia, Alan Robock, Kim Scherrer, Cheryl S. Harrison, Benjamin Leon Bodirsky, Isabelle Weindl, Jonas Jägermeyr, Charles G. Bardeen, Owen B. Toon & Ryan Heneghan from https://www.nature.com/articles/s43016-022-00573-0 with UploadWizard |
You cannot overwrite this file.
File usage on Commons
There are no pages that use this file.