File:Cantons of Luxembourg Density.PNG
Jump to navigation
Jump to search

Size of this preview: 442 × 600 pixels. Other resolutions: 177 × 240 pixels | 354 × 480 pixels | 566 × 768 pixels | 754 × 1,024 pixels | 1,881 × 2,553 pixels.
Original file (1,881 × 2,553 pixels, file size: 226 KB, MIME type: image/png)
Captions
Captions
Add a one-line explanation of what this file represents
Summary
[edit]
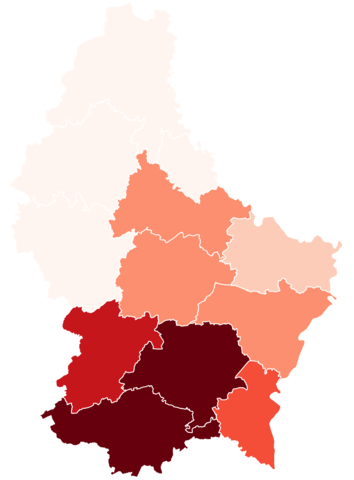
| Description | A map of cantons of Luxembourg colour-coded by population density. Population density is denoted by six different shades of red; in order of increasingly darker shades, the lower bounds (in people/km²) are: 0, 80, 120, 170, 220, 270, 1000. |
| Date | |
| Source | Own work based on Image:Groothertogdom LuxemburgKantons.png. |
| Author | Apelschnaps |
| Permission (Reusing this file) |
Released into the public domain. See licence below. |
Licensing
[edit]
| I, the copyright holder of this work, release this work into the public domain. This applies worldwide. In some countries this may not be legally possible; if so: I grant anyone the right to use this work for any purpose, without any conditions, unless such conditions are required by law. |
File history
Click on a date/time to view the file as it appeared at that time.
| Date/Time | Thumbnail | Dimensions | User | Comment | |
|---|---|---|---|---|---|
| current | 17:32, 23 January 2022 | | 1,881 × 2,553 (226 KB) | Apelschnaps (talk | contribs) | 2021 numbers, new classes |
| 20:45, 26 August 2006 |  | 203 × 270 (4 KB) | Bastin8 (talk | contribs) | {{Information| |Description=A map of cantons of Luxembourg after mergers of 2006-01-01, colour-coded by population density. Population density is denoted by seven different shades of red; in order of increasingly darker shades, the lower bounds (in peopl |
You cannot overwrite this file.
File usage on Commons
The following 2 pages use this file:
File usage on other wikis
The following other wikis use this file:
- Usage on en.wikipedia.org
- Usage on hy.wikipedia.org