File:Canadian oil production 1950 to 2030.svg

Original file (SVG file, nominally 512 × 341 pixels, file size: 16 KB)
Captions
Captions
This file is translated using SVG <switch> elements. All translations are stored in the same file! Learn more.
For most Wikipedia projects, you can embed the file normally (without a To translate the text into your language, you can use the SVG Translate tool. Alternatively, you can download the file to your computer, add your translations using whatever software you're familiar with, and re-upload it with the same name. You will find help in Graphics Lab if you're not sure how to do this. |
Summary
[edit]
| Description |
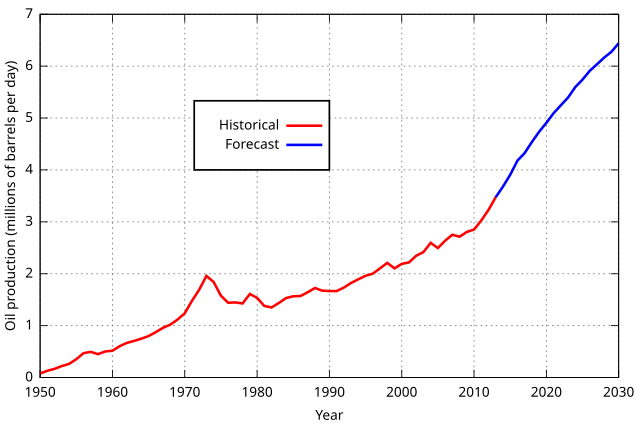
English: Plot of Canadian oil production from 1950 to 2014 and estimate up to 2030 generated using Excel using data from the Canadian National Energy Board (NEB) and the Canadian Association of Petroleum Producers (CAPP).
Français : Tracé de la production canadienne de pétrole de 1950 à 2014, et estimation jusqu'en 2030, générée avec Excel en utilisant des données du Canadian National Energy Board (NEB) et du Canadian Association of Petroleum Producers (CAPP). |
| Date | |
| Source |
|
| Author | Ain92, using modified code by David "RockyMtnGuy" Moe |
| Other versions |
This file was derived from: Canadian Oil Production 1960 to 2020.png  |
#year   #thousands of barrel per day
1947	19,960568
1948	32,48721633
1949	57,53643175
1950	78,44376275
1951	130,1697362
1952	167,0265093
1953	221,2084056
1954	262,7758178
1955	353,9644259
1956	469,0608681
1957	495,9957802
1958	450,9563753
1959	502,7713712
1960	517,8243275
1961	604,2888309
1962	668,6994399
1963	706,7380097
1964	749,7629384
1965	799,2837177
1966	875,3211023
1967	959,9410801
1968	1020,540581
1969	1116,046756
1970	1238,788278
1971	1478,105531
1972	1694,475022
1973	1958,647074
1974	1840,398631
1975	1575,597598
1976	1441,624629
1977	1447,285458
1978	1428,416026
1979	1609,562576
1980	1535,97179
1981	1379,984483
1982	1350,422372
1983	1435,334818
1984	1531,568923
1985	1566,791863
1986	1571,823712
1987	1642,269592
1988	1725,295094
1989	1674,976608
1990	1666,170873
1991	1665,541892
1992	1733,471848
1993	1822,787161
1994	1892,604061
1995	1960,534017
1996	2001,417787
1997	2103,312722
1998	2208,352561
1999	2103,985077
2000	2190,271797
2001	2217,504581
2002	2346,291076
2003	2417,732666
2004	2595,535467
2005	2495,081645
2006	2636,454938
2007	2751,863462
2008	2713,768632
2009	2805,12268
2010	2852,803394
2011	3025,377537
2012	3231,758727
2013	3474,623662
2014	3678,059452
2015	3907,969257
2016	4180,705469
2017	4325,966182
2018	4539,422406
2019	4736,030522
2020	4909,685061
2021	5092,867858
2022	5245,46685
2023	5395,316393
2024	5597,506952
2025	5741,80789
2026	5909,190292
2027	6037,695566
2028	6166,309184
2029	6277,997163
2030	6441,789922
Licensing
[edit]
- You are free:
- to share – to copy, distribute and transmit the work
- to remix – to adapt the work
- Under the following conditions:
- attribution – You must give appropriate credit, provide a link to the license, and indicate if changes were made. You may do so in any reasonable manner, but not in any way that suggests the licensor endorses you or your use.
- share alike – If you remix, transform, or build upon the material, you must distribute your contributions under the same or compatible license as the original.
File history
Click on a date/time to view the file as it appeared at that time.
| Date/Time | Thumbnail | Dimensions | User | Comment | |
|---|---|---|---|---|---|
| current | 15:49, 3 March 2015 | | 512 × 341 (16 KB) | Borvan53 (talk | contribs) | set systemLanguage (french, german, english) |
| 22:12, 7 September 2014 |  | 512 × 341 (15 KB) | Ain92 (talk | contribs) | {{en|1=Plot of Canadian oil production from 1950 to 2014 and estimate up to 2030 generated using Excel using data from the Canadian National Energy Board (NEB) and the Canadian Association of Petroleum Producers (CAPP)}} [[Category:Oil production trend... |
You cannot overwrite this file.
File usage on Commons
The following page uses this file:
File usage on other wikis
The following other wikis use this file:
- Usage on ar.wikipedia.org
- Usage on en.wikipedia.org
- Usage on fr.wikipedia.org
- Usage on no.wikipedia.org
- Usage on th.wikipedia.org