File:CO2 increase rate.png
Jump to navigation
Jump to search

Size of this preview: 800 × 582 pixels. Other resolutions: 320 × 233 pixels | 640 × 465 pixels | 1,024 × 745 pixels | 1,280 × 931 pixels | 1,650 × 1,200 pixels.
Original file (1,650 × 1,200 pixels, file size: 21 KB, MIME type: image/png)
Captions
Captions
Add a one-line explanation of what this file represents
Summary
[edit]

|
This graph image could be re-created using vector graphics as an SVG file. This has several advantages; see Commons:Media for cleanup for more information. If an SVG form of this image is available, please upload it and afterwards replace this template with
{{vector version available|new image name}}.
It is recommended to name the SVG file “CO2 increase rate.svg”—then the template Vector version available (or Vva) does not need the new image name parameter. |
| Description |
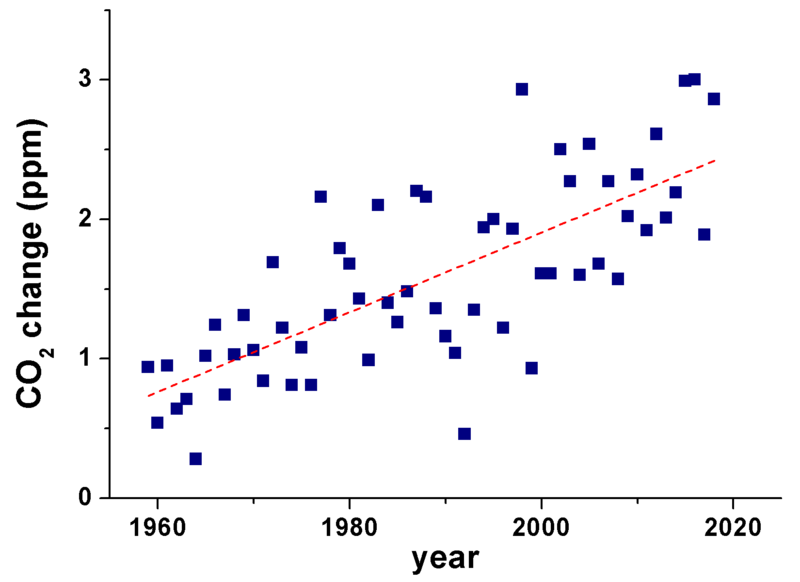
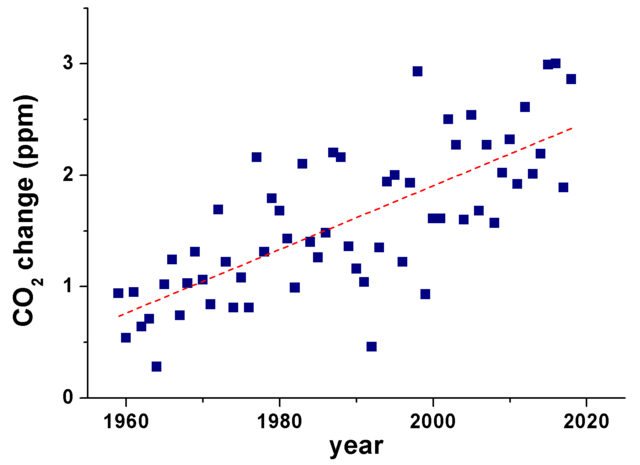
English: Year-over-year increase of atmospheric CO2 |
| Date | Renerpho (talk) 08:45, 9 May 2019 (UTC) |
| Source | Updated the old chart (1959-2007) by New Image Uploader 929, with more recent data up to 2018 from Pieter Tans "Annual CO2 mole fraction increase (ppm)" for 1959-2018 National Oceanic and Atmospheric Administration |
| Author | Renerpho (talk) |
| Other versions | العربيَّة |
Licensing
[edit]
Renerpho at the English Wikipedia, the copyright holder of this work, hereby publishes it under the following license:

|
Permission is granted to copy, distribute and/or modify this document under the terms of the GNU Free Documentation License, Version 1.2 or any later version published by the Free Software Foundation; with no Invariant Sections, no Front-Cover Texts, and no Back-Cover Texts. A copy of the license is included in the section entitled GNU Free Documentation License. |
| This file is licensed under the Creative Commons Attribution-Share Alike 3.0 Unported license. | ||
| Attribution: Renerpho at the English Wikipedia | ||
| ||
| This licensing tag was added to this file as part of the GFDL licensing update. |
Original upload log
[edit]
Transferred from en.wikipedia to Commons by Teratornis using CommonsHelper.
The original description page was here. All following user names refer to en.wikipedia.
- 2008-05-30 11:01 New Image Uploader 929 690×600× (16333 bytes)
- 2008-05-30 08:01 New Image Uploader 929 561×395× (14292 bytes) slightly better?
- 2008-05-30 07:57 New Image Uploader 929 561×395× (13023 bytes) label axes
- 2008-05-30 03:21 New Image Uploader 929 539×379× (10732 bytes) {{Information |Description=Year-over-year increase in atmospheric CO<sub>2</sub> increase. |Source=I created this image with help (numerical data only) from Dr. Pieter Tans (3 May 2008) [ftp://ftp.cmdl.noaa.gov/ccg/co2/trends/co2_gr_mlo.txt
File history
Click on a date/time to view the file as it appeared at that time.
| Date/Time | Thumbnail | Dimensions | User | Comment | |
|---|---|---|---|---|---|
| current | 08:38, 9 May 2019 | | 1,650 × 1,200 (21 KB) | Renerpho (talk | contribs) | Update, adding 10 years (2009-2018) and a linear fit. |
| 07:36, 8 October 2009 |  | 690 × 600 (16 KB) | File Upload Bot (Magnus Manske) (talk | contribs) | {{BotMoveToCommons|en.wikipedia|year={{subst:CURRENTYEAR}}|month={{subst:CURRENTMONTHNAME}}|day={{subst:CURRENTDAY}}}} {{Information |Description={{en|Year-over-year increase of atmospheric CO<sub>2</sub>}} |Source=Transferred from [http://en.wikipedia.o |
You cannot overwrite this file.
File usage on Commons
There are no pages that use this file.
File usage on other wikis
The following other wikis use this file:
- Usage on ar.wikipedia.org
- Usage on ast.wikipedia.org
- Usage on ca.wikipedia.org
- Usage on en.wikipedia.org
- Usage on es.wikipedia.org
- Usage on fr.wikipedia.org
- Usage on gu.wikipedia.org
- Usage on hi.wikipedia.org
- Usage on id.wikipedia.org
- Usage on ta.wikipedia.org
- Usage on te.wikipedia.org
- Usage on uk.wikipedia.org