File:Bar plot of average number of de novo mutations by chromosome.jpg
Jump to navigation
Jump to search
Size of this preview: 517 × 599 pixels. Other resolutions: 207 × 240 pixels | 414 × 480 pixels | 946 × 1,096 pixels.
Original file (946 × 1,096 pixels, file size: 109 KB, MIME type: image/jpeg)
Captions
Captions
Add a one-line explanation of what this file represents
Summary
[edit]
| Description |
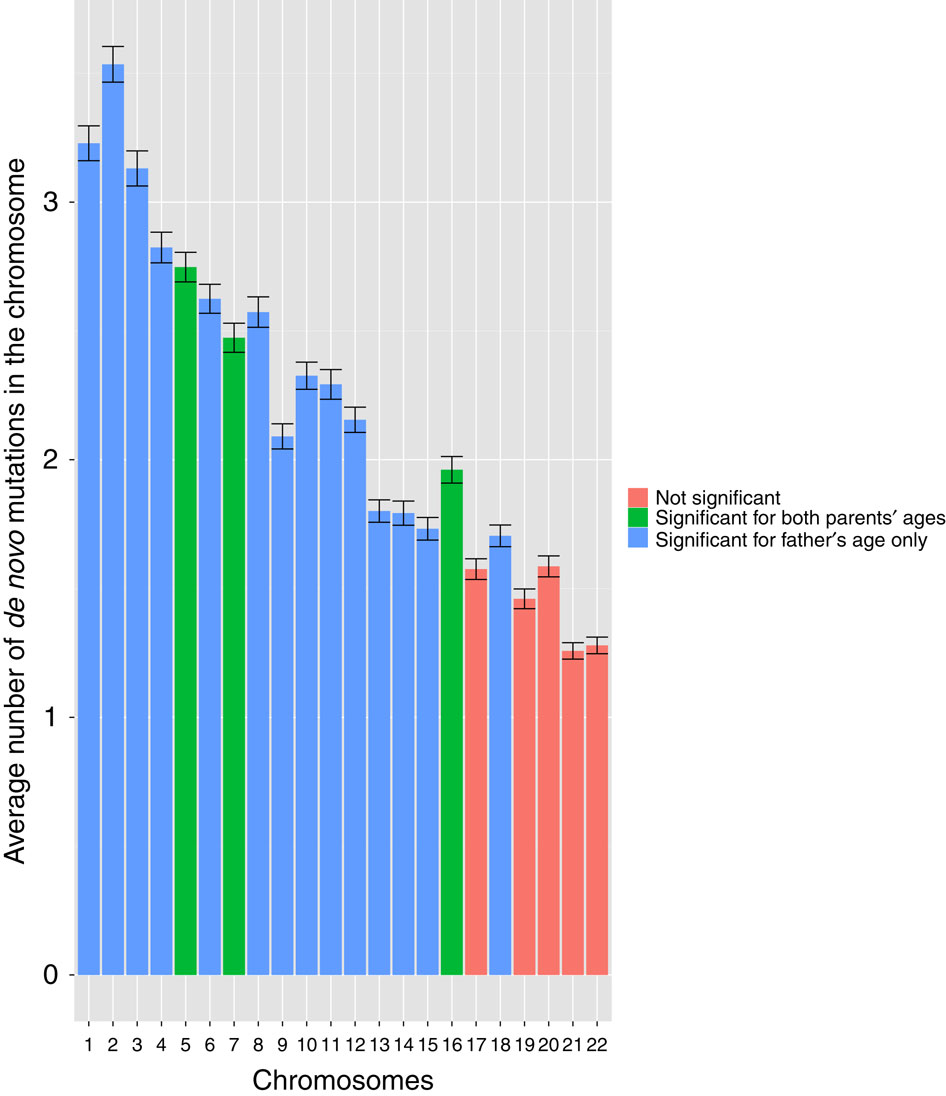
English: Bar plot of average number of de novo mutations by chromosome. The average number of de novo point mutations (DNMs) in each autosome are largely correlated with the chromosome sizes. The error bars represent the s.e. (standard error) of the mean DNMs for each chromosome. Numbers of DNMs in chromosomes 17, 19, 20, 21 and 22 are not significant for either father’s or mother’s age (P>0.05). Numbers of DNMs in chromosomes 1–4, 6, 8–15 and 18 are significantly correlated with father’s age only. Numbers of DNMs in chromosomes 5, 7, 16 are significantly correlated with both parents’ ages.
|
| Date | Published 19 January 2016 |
| Source | Wong, W. S. W. et al. New observations on maternal age effect on germline de novo mutations. Nat. Commun. 7:10486 doi: 10.1038/ncomms10486 (2016). http://www.nature.com/ncomms/2016/160119/ncomms10486/full/ncomms10486.html |
| Author | Wendy S. W. Wong, Benjamin D. Solomon, Dale L. Bodian, Prachi Kothiyal, Greg Eley, Kathi C. Huddleston, Robin Baker, Dzung C. Thach, Ramaswamy K. Iyer, Joseph G. Vockley & John E. Niederhuber |
| Other versions |
   |
Licensing
[edit]
This file is licensed under the Creative Commons Attribution 4.0 International license.
- You are free:
- to share – to copy, distribute and transmit the work
- to remix – to adapt the work
- Under the following conditions:
- attribution – You must give appropriate credit, provide a link to the license, and indicate if changes were made. You may do so in any reasonable manner, but not in any way that suggests the licensor endorses you or your use.
File history
Click on a date/time to view the file as it appeared at that time.
| Date/Time | Thumbnail | Dimensions | User | Comment | |
|---|---|---|---|---|---|
| current | 07:42, 22 September 2016 | | 946 × 1,096 (109 KB) | Was a bee (talk | contribs) | {{Information |Description={{en|1=Bar plot of average number of de novo mutations by chromosome. The average number of de novo point mutations (DNMs) in each autosome are largely correlated with the chromosome sizes. The error bars represent the s.e. (... |
You cannot overwrite this file.
File usage on Commons
The following 3 pages use this file:
- File:Distribution of the ratios between number of DNMs of maternal origin and paternal origin.png
- File:Histograms of Age of Father, Mother and Newborn - Coloring with Number of mutations.png
- File:Scatter plots with linear regression line on parental ages and their respective number of de novo mutations.jpg