File:BTCvolatility.svg

Original file (SVG file, nominally 567 × 319 pixels, file size: 57 KB)
Captions
Captions
Summary
[edit]| Description |
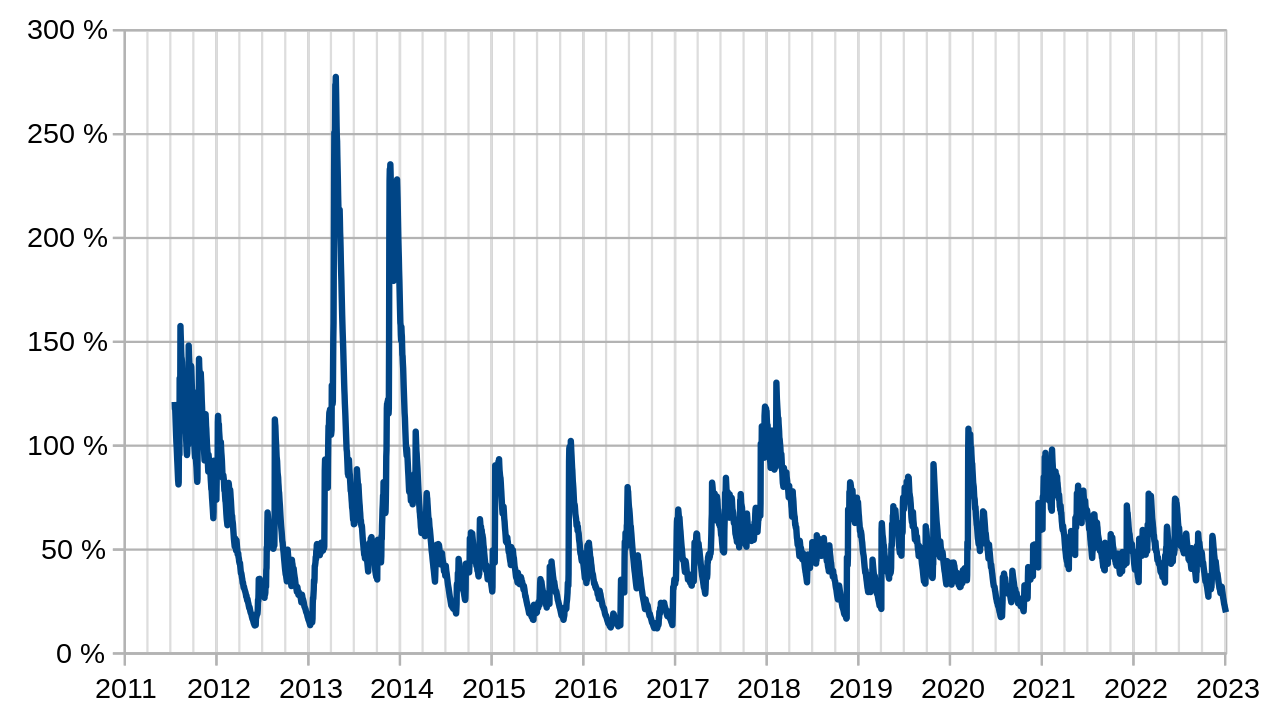
English: Annual volatility of BTC |
| Date | |
| Source | Own work |
| Author | Ladislav Mecir |
Licensing
[edit]- You are free:
- to share – to copy, distribute and transmit the work
- to remix – to adapt the work
- Under the following conditions:
- attribution – You must give appropriate credit, provide a link to the license, and indicate if changes were made. You may do so in any reasonable manner, but not in any way that suggests the licensor endorses you or your use.
- share alike – If you remix, transform, or build upon the material, you must distribute your contributions under the same or compatible license as the original.
Updated data up to 6 October 2021.
blockchain.com only provides data for 1 in 3 days. That is less than the 252 or 261 samples per year used on volatility calculation for the stock market. This is why I have used a different data source (bitcoinvisuals.com). Lack of precision of no more than one cent of a dollar on low prices around year 2010 accounts for a significant part of the lack of precision on the volatility at the left side of the chart. Thus volatility in early 2011 is not accurate.
I provide line chart of EWMA volatility, one price sample per day for 365 contiguous days, λ with value 0.94, divided by 261 days (as it is typical in stock market calculations).
Volatility formula on chart:

Newer versions of this file with a different license can be found here: 
File history
Click on a date/time to view the file as it appeared at that time.
| Date/Time | Thumbnail | Dimensions | User | Comment | |
|---|---|---|---|---|---|
| current | 21:36, 9 January 2023 | | 567 × 319 (57 KB) | FrankAndProust (talk | contribs) | Added data up to 4 January 2023 |
| 21:31, 8 October 2022 |  | 567 × 319 (55 KB) | FrankAndProust (talk | contribs) | Added data up to 6 October 2022 | |
| 21:45, 17 June 2022 |  | 567 × 319 (53 KB) | FrankAndProust (talk | contribs) | Added data up to 15 June 2022 | |
| 22:52, 8 February 2022 |  | 567 × 319 (53 KB) | FrankAndProust (talk | contribs) | Updated data up to 6 February 2022 | |
| 17:35, 8 October 2021 |  | 567 × 319 (52 KB) | FrankAndProust (talk | contribs) | Updated data up to 6 October 2021. blockchain.com only provides data for 1 in 3 days. That is less than the 252 or 261 samples per year used on volatility calculation for the stock market. This is why I have used a different data source. Lack of precision of no more than one cent of a dollar on low prices around year 2010 accounts for a significant part of the lack of precision on the volatility at the left side of the chart. Thus volatility in early 2011 is not accurate. I provide line char... | |
| 12:43, 23 January 2020 |  | 567 × 319 (38 KB) | Ladislav Mecir (talk | contribs) | Add data up to 15 January 2020 | |
| 11:22, 1 November 2019 |  | 567 × 319 (24 KB) | Ladislav Mecir (talk | contribs) | Add vertical grid, adjust maximum of the horizontal axis, add data up to 31 October 2019. | |
| 15:58, 16 October 2019 |  | 567 × 319 (24 KB) | Ladislav Mecir (talk | contribs) | User created page with UploadWizard |
You cannot overwrite this file.
File usage on Commons
The following page uses this file:
File usage on other wikis
The following other wikis use this file:
- Usage on bn.wikipedia.org
- Usage on en.wikipedia.org