File:Australian Census 2011 demographic map - Inner Sydney by SLA - BCP field 5585 Different usual address 5 years ago Same Statistical Area Level 2 SA2 Males.svg
Jump to navigation
Jump to search

Size of this PNG preview of this SVG file: 800 × 588 pixels. Other resolutions: 320 × 235 pixels | 640 × 471 pixels | 1,024 × 753 pixels | 1,280 × 941 pixels | 2,560 × 1,883 pixels | 2,000 × 1,471 pixels.
Original file (SVG file, nominally 2,000 × 1,471 pixels, file size: 2.92 MB)
Captions
Captions
Add a one-line explanation of what this file represents
Summary
[edit]
| Description |
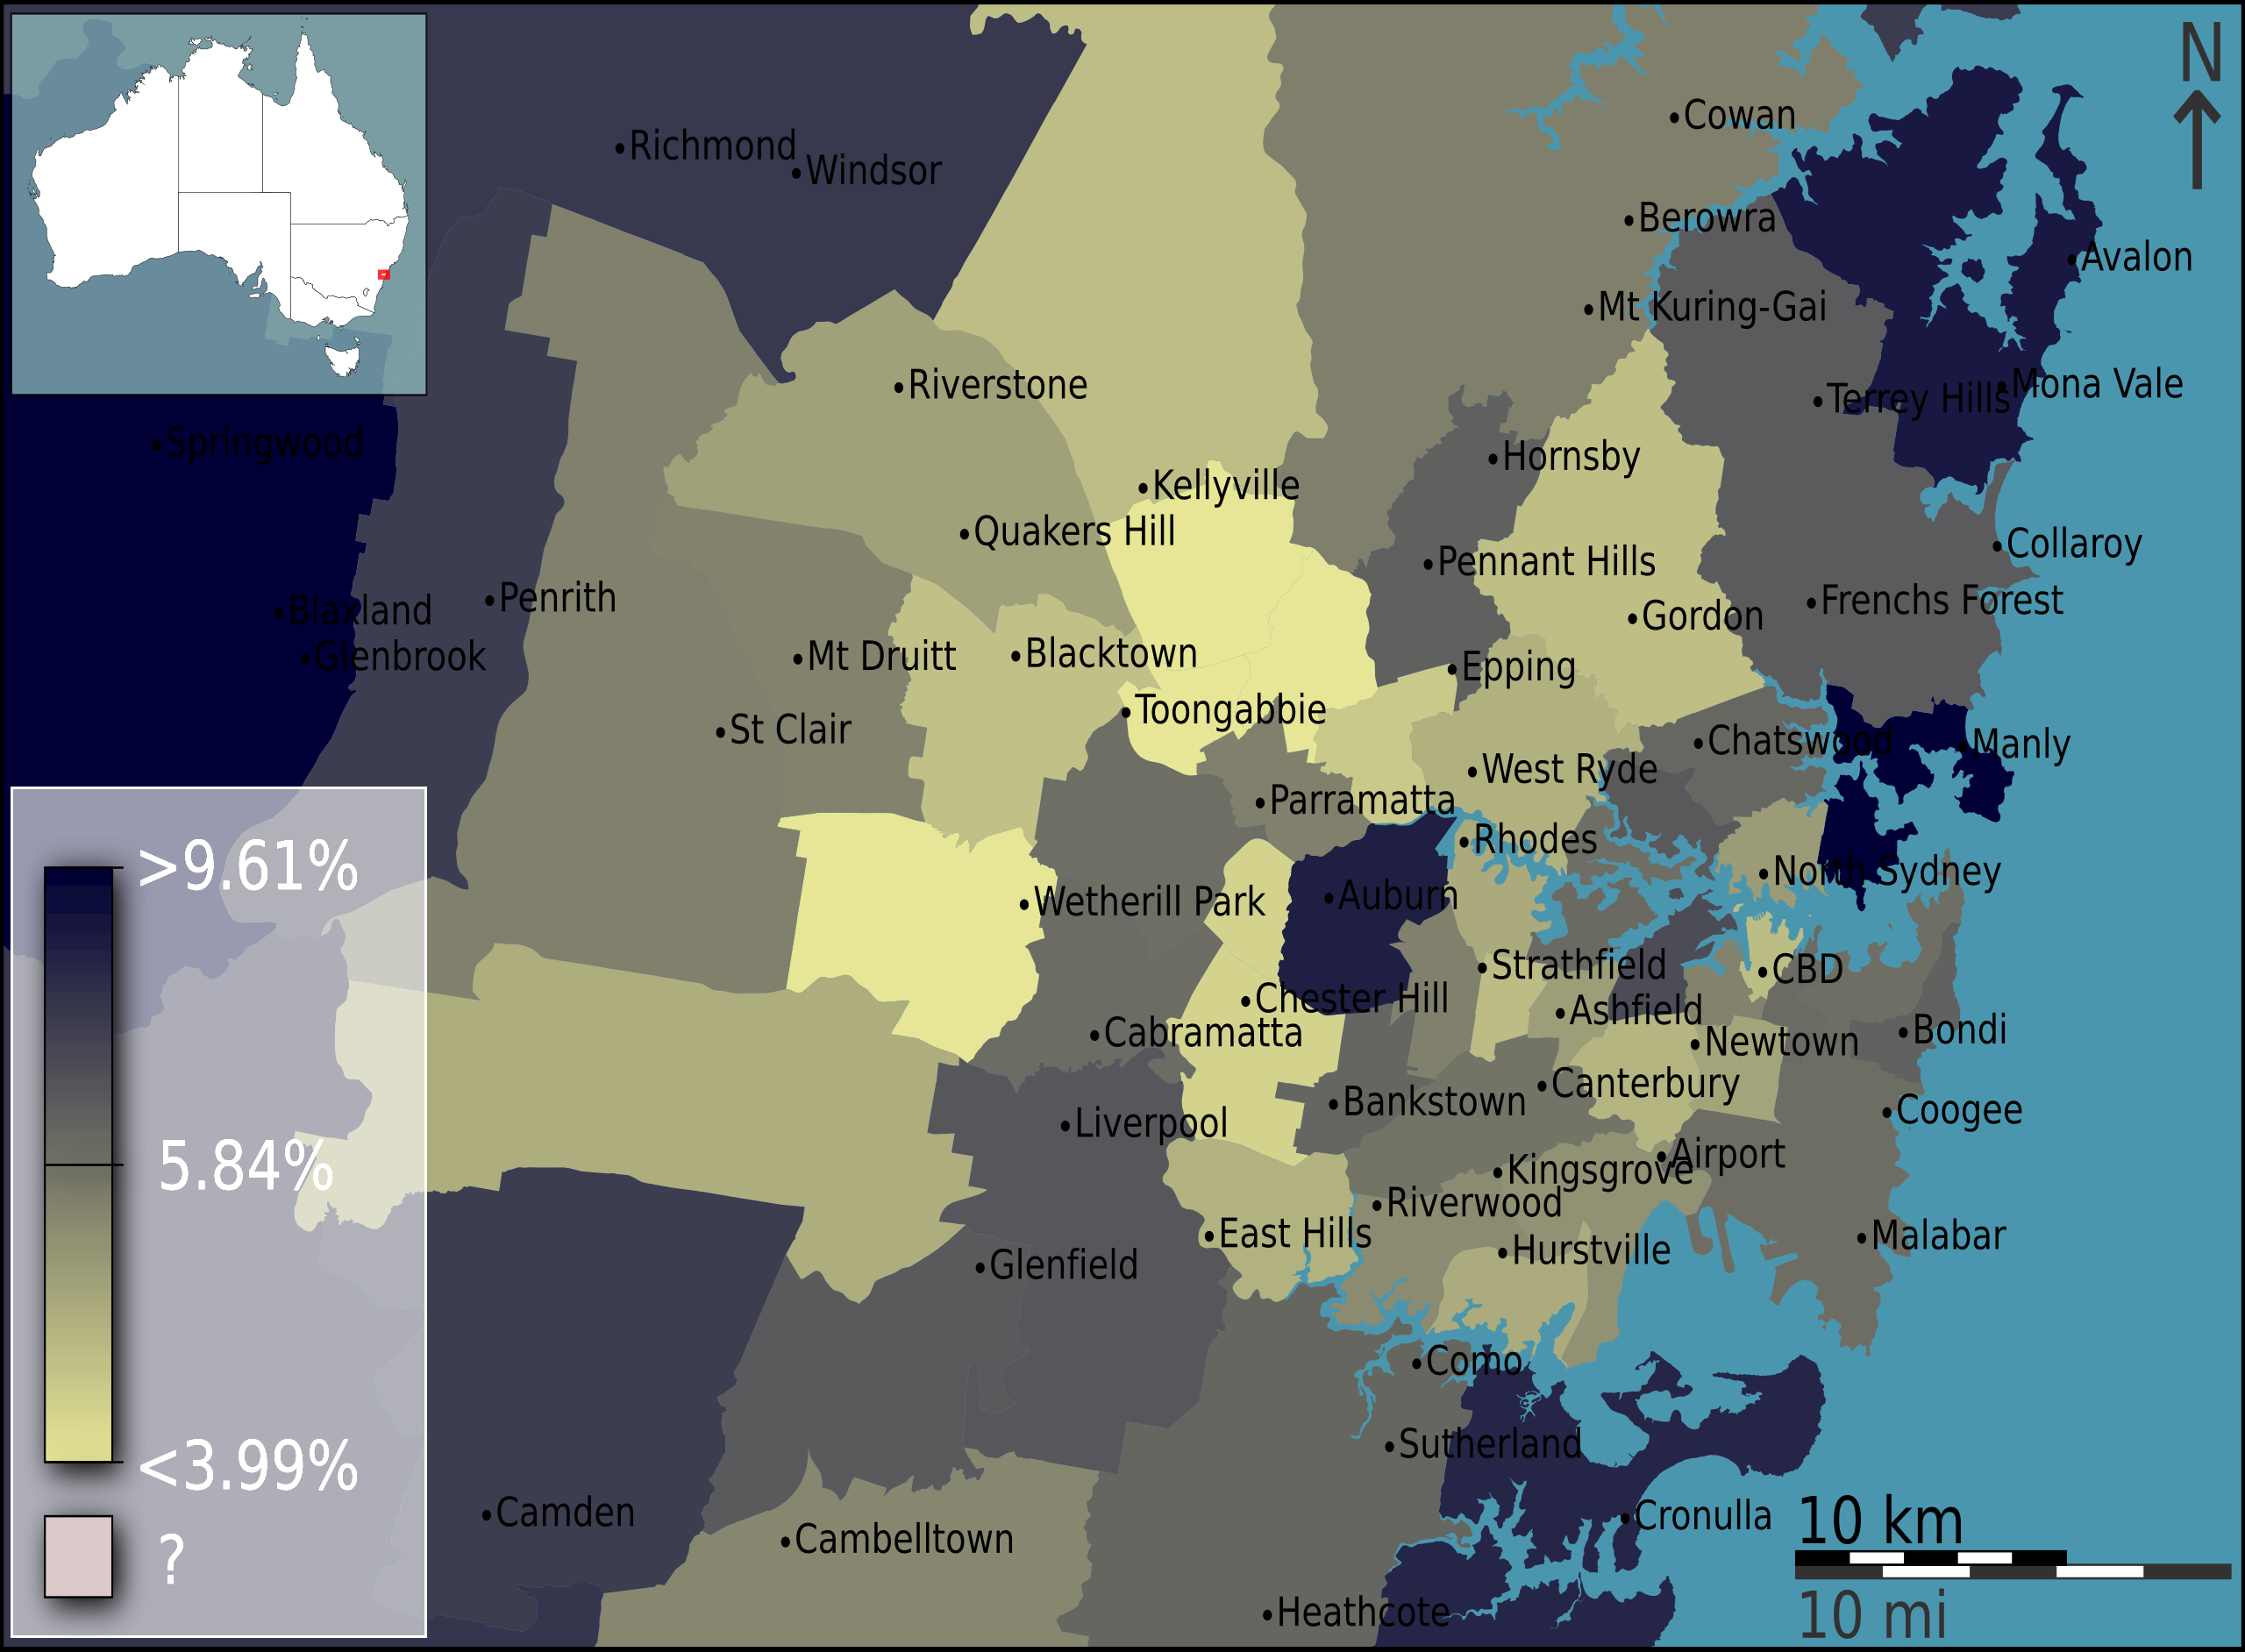
English: Different usual address 5 years ago Same Statistical Area Level 2 SA2 Males as a fraction of total males aged 5 and over, in Inner Sydney, Australia, according to the 2011 census results. The map is divided into geographical subdivisions by Statistical Local Area. Note the split scale above and below the median value. |
||
| Date | |||
| Source |
Own work
|
||
| Author | Toby Hudson |
Licensing
[edit]
I, the copyright holder of this work, hereby publish it under the following license:
This file is licensed under the Creative Commons Attribution-Share Alike 3.0 Australia license.
- You are free:
- to share – to copy, distribute and transmit the work
- to remix – to adapt the work
- Under the following conditions:
- attribution – You must give appropriate credit, provide a link to the license, and indicate if changes were made. You may do so in any reasonable manner, but not in any way that suggests the licensor endorses you or your use.
- share alike – If you remix, transform, or build upon the material, you must distribute your contributions under the same or compatible license as the original.

File history
Click on a date/time to view the file as it appeared at that time.
| Date/Time | Thumbnail | Dimensions | User | Comment | |
|---|---|---|---|---|---|
| current | 06:50, 11 May 2013 | | 2,000 × 1,471 (2.92 MB) | File Upload Bot (99of9) (talk | contribs) | =={{int:filedesc}}== {{Information |Description={{en|Different usual address 5 years ago Same Statistical Area Level 2 SA2 Males as a fraction of total males aged 5 and over, in Inner Sydney, Australia, according to the 2011 census results. The map is ... |
You cannot overwrite this file.
File usage on Commons
There are no pages that use this file.
Metadata
Categories:
- Demographic maps of Inner Sydney by Statistical Local Area based on the 2011 Census of Population and Housing
- Demographic maps of males who lived at a different address five years ago in the same statistical area (level 2) in Inner Sydney
- Demographic maps of males who lived at a different address five years ago in the same statistical area (level 2) by Statistical Local Area