File:Asinobstfeldrogoff.png

Original file (818 × 714 pixels, file size: 28 KB, MIME type: image/png)
Captions
Captions
Summary
[edit]
| Description |
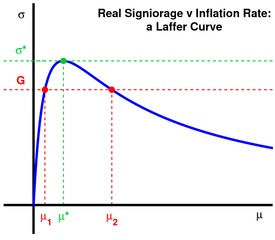
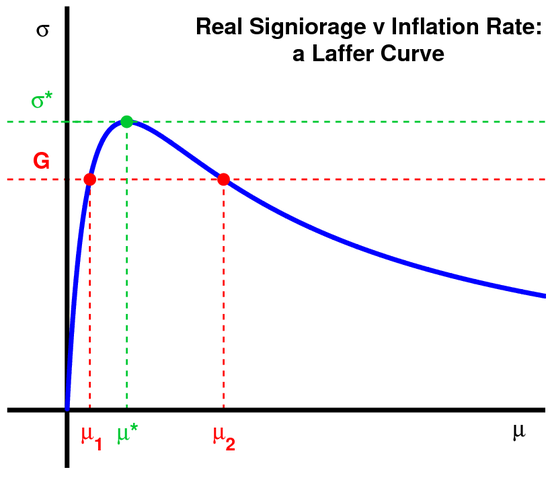
English: Real Signiorage vs. Inflation Rate (Laffer Curve) |
| Date | 9 July 2010 (upload date) |
| Source | Own work |
| Author | Picodoro |
The curve is as in Maurice Obstfeld, Kenneth S. Rogoff, Foundations of International Macroeconomics, Massachusetts Institute of Technology, 1996, ISBN 0262150476 (chapter 8, Money and Exchange Rates under Flexible Prices, section 2, The Cagan Model of Money and Prices, paragraph 6, Seigniorage, pp. 523-525). The matlab code to generate the image is as follows (although I made some minor manual adjustments):
gm = [0:0.001:8];
eta = 1;
S = gm .* ((1 + gm) .^ (-eta - 1));
gm_star = 1 / eta;
S_star = gm_star * ((1 + gm_star) ^ (-eta - 1));
G = 0.2;
syms x real;
gm_G = eval(solve(x * ((1 + x) ^ (-eta - 1)) - G, 'x'));
figure1 = figure('Position', [393 18 782 686], 'PaperPosition',[0.1322 5.764 20.67 18.14], 'PaperSize',[20.98 29.68], 'PaperType','a4letter');
set(gcf, 'Color', 'none');
plot([-2, 8], [S_star, S_star], '--', 'Color', [0, 200, 50] / 255, 'LineWidth', 2)
hold on
plot([gm_star, gm_star], [0, S_star], '--', 'Color', [0, 200, 50] / 255, 'LineWidth', 2)
plot([gm_G(1), gm_G(1)], [0, G], '--r', 'LineWidth', 2)
plot([gm_G(2), gm_G(2)], [0, G], '--r', 'LineWidth', 2)
plot([-2, 10], [G, G], '--r', 'LineWidth', 2)
plot([-2, 8], [0, 0], '-k', 'LineWidth', 5)
plot([0, 0], [-0.1, 0.4], '-k', 'LineWidth', 5)
plot(gm, S, '-', 'LineWidth', 5)
plot(gm_G(1), G, '.r', 'MarkerSize', 40)
plot(gm_G(2), G, '.r', 'MarkerSize', 40)
plot(gm_star, S_star, '.', 'Color', [0, 200, 50] / 255, 'MarkerSize', 40)
set(gca, 'XLim', [-1, 8]);
set(gca, 'YLim', [-.05, .35]);
set(gca, 'Color', 'none', 'LineWidth', 2, 'FontSize', 16, 'FontWeight', 'bold', 'Box', 'off', 'Position', [0.0179028 0.0335277 0.971867 0.950437], ...
- 'OuterPosition', [-0.14512 -0.0947522 1.25402 1.16618])
- 'OuterPosition', [-0.14512 -0.0947522 1.25402 1.16618])
set(gca, 'Visible', 'off')
annotation1 = annotation(...
- figure1, 'textbox', ...
- 'BackgroundColor', 'none', ...
- 'FitHeightToText', 'off', ...
- 'FontSize', 24, ...
- 'FontWeight', 'bold', ...
- 'HorizontalAlignment', 'center', ...
- 'LineStyle', 'none', ...
- 'Position', [0.8963 0.0609 0.0875 0.1143],...
- 'String',{'\mu'});
- figure1, 'textbox', ...
annotation2 = annotation(...
- figure1, 'textbox', ...
- 'BackgroundColor', 'none', ...
- 'FitHeightToText', 'off', ...
- 'Color', 'r', ...
- 'FontSize', 24, ...
- 'FontWeight', 'bold', ...
- 'HorizontalAlignment', 'center', ...
- 'LineStyle', 'none', ...
- 'Position', [0.2480 0.0624 0.0875 0.1143],...
- 'String',{'\mu_1'});
- figure1, 'textbox', ...
annotation3 = annotation(...
- figure1, 'textbox', ...
- 'BackgroundColor', 'none', ...
- 'FitHeightToText', 'off', ...
- 'Color', 'r', ...
- 'FontSize', 24, ...
- 'FontWeight', 'bold', ...
- 'HorizontalAlignment', 'center', ...
- 'LineStyle', 'none', ...
- 'Position', [0.5805 0.0609 0.0875 0.1143],...
- 'String',{'\mu_2'});
- figure1, 'textbox', ...
annotation4 = annotation(...
- figure1, 'textbox', ...
- 'BackgroundColor', 'none', ...
- 'FitHeightToText', 'off', ...
- 'Color', [0, 200, 50] / 255, ...
- 'FontSize', 24, ...
- 'FontWeight', 'bold', ...
- 'HorizontalAlignment', 'center', ...
- 'LineStyle', 'none', ...
- 'Position', [0.3656 0.0610 0.0875 0.1143],...
- 'String',{'\mu*'});
- figure1, 'textbox', ...
annotation5 = annotation(...
- figure1, 'textbox', ...
- 'BackgroundColor', 'none', ...
- 'FitHeightToText', 'off', ...
- 'Color', [0, 200, 50] / 255, ...
- 'FontSize', 24, ...
- 'FontWeight', 'bold', ...
- 'HorizontalAlignment', 'center', ...
- 'LineStyle', 'none', ...
- 'Position', [0.1239 0.7184 0.0875 0.1143],...
- 'String',{'\sigma*'});
- figure1, 'textbox', ...
annotation6 = annotation(...
- figure1, 'textbox', ...
- 'BackgroundColor', 'none', ...
- 'FitHeightToText', 'off', ...
- 'FontSize', 24, ...
- 'FontWeight', 'bold', ...
- 'HorizontalAlignment', 'center', ...
- 'LineStyle', 'none', ...
- 'Position', [0.1162 0.8641 0.0875 0.1143],...
- 'String',{'\sigma'});
- figure1, 'textbox', ...
annotation7 = annotation(...
- figure1, 'textbox', ...
- 'BackgroundColor', 'none', ...
- 'FitHeightToText', 'off', ...
- 'Color', 'r', ...
- 'FontSize', 24, ...
- 'FontWeight', 'bold', ...
- 'HorizontalAlignment', 'center', ...
- 'LineStyle', 'none', ...
- 'Position', [0.1253 0.5449 0.0875 0.1143],...
- 'String',{'G'});
- figure1, 'textbox', ...
annotation6 = annotation(...
- figure1, 'textbox', ...
- 'BackgroundColor', 'none', ...
- 'FitHeightToText', 'off', ...
- 'FontSize', 24, ...
- 'FontWeight', 'bold', ...
- 'HorizontalAlignment', 'center', ...
- 'LineStyle', 'none', ...
- 'Position', [0.1162 0.8641 0.0875 0.1143],...
- 'String',{['Real Signiorage v Inflation Rate:'; ' a Laffer Curve ']});
- figure1, 'textbox', ...
Licensing
[edit]
- You are free:
- to share – to copy, distribute and transmit the work
- to remix – to adapt the work
- Under the following conditions:
- attribution – You must give appropriate credit, provide a link to the license, and indicate if changes were made. You may do so in any reasonable manner, but not in any way that suggests the licensor endorses you or your use.
- share alike – If you remix, transform, or build upon the material, you must distribute your contributions under the same or compatible license as the original.

|
Permission is granted to copy, distribute and/or modify this document under the terms of the GNU Free Documentation License, Version 1.2 or any later version published by the Free Software Foundation; with no Invariant Sections, no Front-Cover Texts, and no Back-Cover Texts. A copy of the license is included in the section entitled GNU Free Documentation License. |
File history
Click on a date/time to view the file as it appeared at that time.
| Date/Time | Thumbnail | Dimensions | User | Comment | |
|---|---|---|---|---|---|
| current | 10:17, 9 July 2010 | | 818 × 714 (28 KB) | Picodoro (talk | contribs) | {{Information |Description={{en|1=Real Signiorage vs. Inflation Rate (Laffer Curve)}} |Source={{own}} |Author=Picodoro |Date=9/07/2010 |Permission= |other_versions= }} The curve is as in Maurice Obstfeld, Kenneth S. Rogoff, ''Foundations |
You cannot overwrite this file.
File usage on Commons
There are no pages that use this file.
File usage on other wikis
The following other wikis use this file:
- Usage on gl.wikipedia.org
- Usage on it.wikiversity.org