File:Arc length, Fermat.svg
Jump to navigation
Jump to search

Size of this PNG preview of this SVG file: 597 × 600 pixels. Other resolutions: 239 × 240 pixels | 478 × 480 pixels | 764 × 768 pixels | 1,019 × 1,024 pixels | 2,038 × 2,048 pixels | 615 × 618 pixels.
Original file (SVG file, nominally 615 × 618 pixels, file size: 26 KB)
Captions
Captions
Add a one-line explanation of what this file represents
Summary
[edit]
| Description |
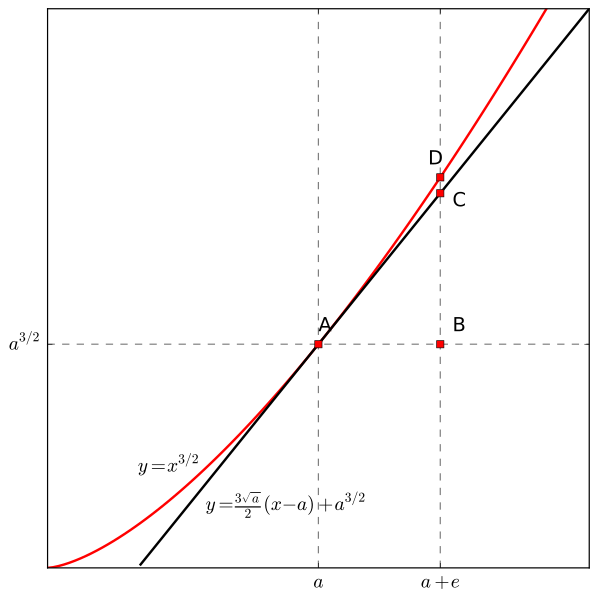
English: This graph is meant to help accompany the article Length of an arc and describe the method Fermat used.
Español: Ilustración del método de Fermat para calcular la longitud de arco de una curva. |
| Date | |
| Source | Own work |
| Author | Nicoguaro |
| SVG development | This plot was created with Matplotlib. |
| Source code | Python codeimport numpy as np
import matplotlib.pyplot as plt
from matplotlib import rcParams
rcParams['font.size'] = 16
fun = lambda x: x**1.5
tangent = lambda x, a: 1.5*a**0.5*(x - a) + a**1.5
a = 0.6
e = 0.45*a
lo = e/10 # Offset of annotations
# Principal plots
x = np.linspace(0, 1.2, 100)
y1 = fun(x)
y2 = tangent(x, a)
fig = plt.figure(figsize=(8, 8))
ax = fig.add_subplot(1, 1, 1)
plt.plot(x, y1, "r", lw=2)
plt.plot(x[y2>=0], y2[y2>=0], "k", lw=2)
# Auxiliar lines
plt.plot([0, 1.2], [fun(a), fun(a)], "--k", lw=1, alpha=0.5)
plt.plot([a, a], [0, y2[-1]], "--k", lw=1, alpha=0.5)
plt.plot([a + e, a + e], [0, y2[-1]], "--k", lw=1, alpha=0.5)
# Intersections points
plt.plot(a, fun(a), 'rs')
plt.annotate("A", xy=(a, fun(a) + lo))
plt.plot(a + e, fun(a), 'rs')
plt.annotate("B", xy=(a + e + lo, fun(a) + lo))
plt.plot(a + e, tangent(a+e, a), 'rs')
plt.annotate("C", xy=(a + e + lo, tangent(a+e, a) - lo))
plt.plot(a + e, fun(a+e), 'rs')
plt.annotate("D", xy=(a + e - lo, fun(a+e) + lo))
# Functions labels
plt.annotate(r"$y=x^{3/2}$", xy=(0.2, 0.2))
plt.annotate(r"$y=\frac{3\sqrt{a}}{2} (x - a) + a^{3/2}$", xy=(0.35, 0.12))
plt.xlim([0, 1.2])
plt.ylim([0, 2.5*fun(a)])
plt.xticks([a, a+e], [r"$a$", r"$a + e$"])
plt.yticks([fun(a)], [r"$a^{3/2}$"])
plt.savefig("Arc length, Fermat.svg", bbox_inches="tight")
plt.show()
|
Licensing
[edit]
I, the copyright holder of this work, hereby publish it under the following license:
This file is licensed under the Creative Commons Attribution 4.0 International license.
- You are free:
- to share – to copy, distribute and transmit the work
- to remix – to adapt the work
- Under the following conditions:
- attribution – You must give appropriate credit, provide a link to the license, and indicate if changes were made. You may do so in any reasonable manner, but not in any way that suggests the licensor endorses you or your use.
File history
Click on a date/time to view the file as it appeared at that time.
| Date/Time | Thumbnail | Dimensions | User | Comment | |
|---|---|---|---|---|---|
| current | 16:42, 12 February 2016 | | 615 × 618 (26 KB) | Nicoguaro (talk | contribs) | Fit lines inside the plotting box and change some colors. |
| 16:33, 12 February 2016 |  | 615 × 618 (25 KB) | Nicoguaro (talk | contribs) | User created page with UploadWizard |
You cannot overwrite this file.
File usage on Commons
The following page uses this file:
File usage on other wikis
The following other wikis use this file:
- Usage on el.wikipedia.org
- Usage on en.wikipedia.org
- Usage on ja.wikipedia.org