File:Aggregate supply es.svg
Jump to navigation
Jump to search

Size of this PNG preview of this SVG file: 600 × 400 pixels. Other resolutions: 320 × 213 pixels | 640 × 427 pixels | 1,024 × 683 pixels | 1,280 × 853 pixels | 2,560 × 1,707 pixels.
Original file (SVG file, nominally 600 × 400 pixels, file size: 14 KB)
Captions
Captions
Add a one-line explanation of what this file represents
| Description |
This W3C-unspecified vector image was created with Inkscape . |
| Date | (UTC) |
| Source | |
| Author |
|
| This is a retouched picture, which means that it has been digitally altered from its original version. Modifications: Spanish version. The original can be viewed here: Aggregate supply.svg:
|
I, the copyright holder of this work, hereby publish it under the following licenses:
This file is licensed under the Creative Commons Attribution 3.0 Unported license.
- You are free:
- to share – to copy, distribute and transmit the work
- to remix – to adapt the work
- Under the following conditions:
- attribution – You must give appropriate credit, provide a link to the license, and indicate if changes were made. You may do so in any reasonable manner, but not in any way that suggests the licensor endorses you or your use.

|
Permission is granted to copy, distribute and/or modify this document under the terms of the GNU Free Documentation License, Version 1.2 or any later version published by the Free Software Foundation; with no Invariant Sections, no Front-Cover Texts, and no Back-Cover Texts. A copy of the license is included in the section entitled GNU Free Documentation License. |
You may select the license of your choice.
Original upload log
[edit]
This image is a derivative work of the following images:
- File:Aggregate_supply.svg licensed with Cc-by-3.0, GFDL
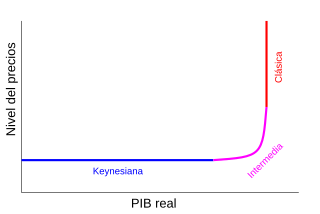
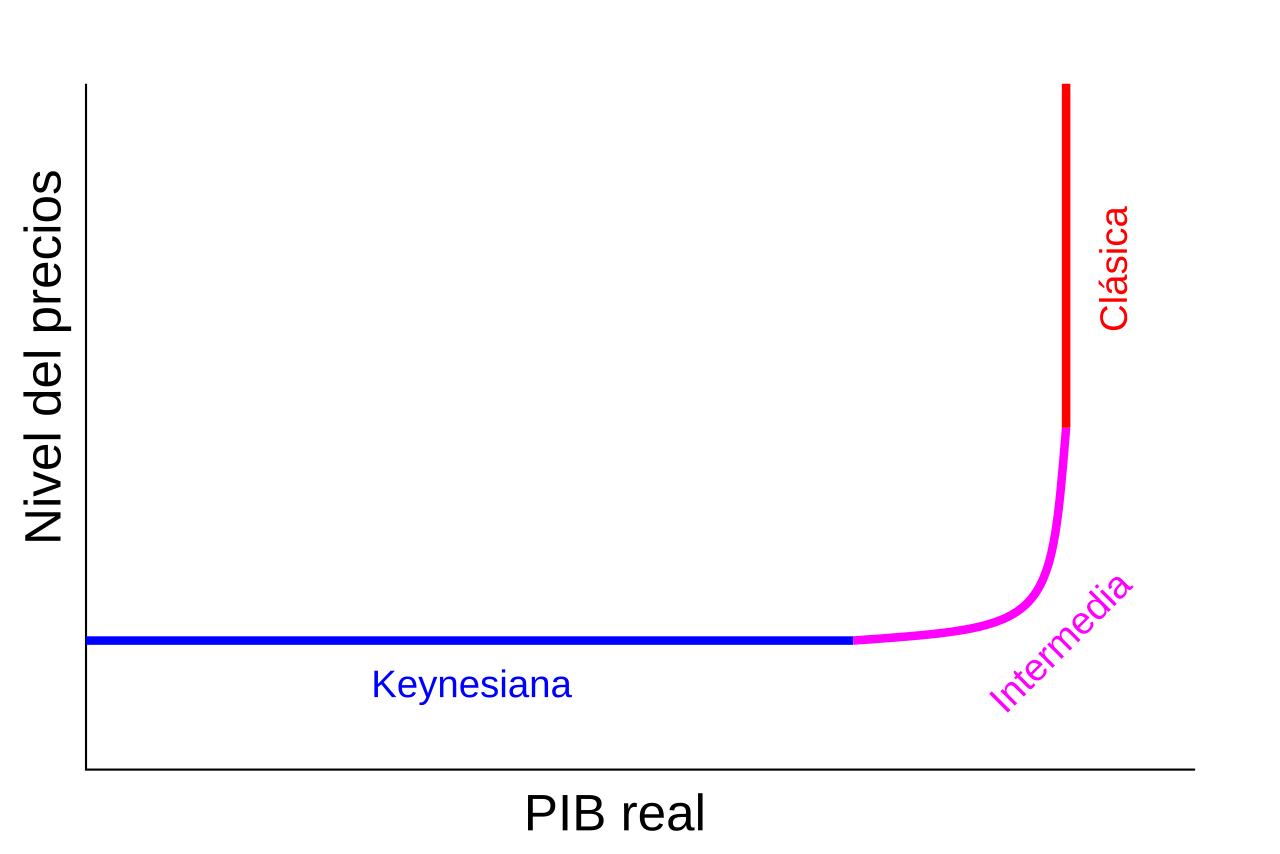
- 2008-02-02T05:57:17Z King of Hearts 600x400 (7111 Bytes) {{Information |Description={{Inkscape}} The [[w:Aggregate supply]] curve, shown with three ranges: #''Keynesian range'', in which prices are so low that companies would rather lower production than sell at a loss; #''Intermed
Uploaded with derivativeFX
File history
Click on a date/time to view the file as it appeared at that time.
| Date/Time | Thumbnail | Dimensions | User | Comment | |
|---|---|---|---|---|---|
| current | 19:54, 15 August 2010 | | 600 × 400 (14 KB) | Oscar . (talk | contribs) | {{Information |Description={{Inkscape}} The Aggregate supply curve, shown with three ranges: #''Keynesian range'', in which prices are so low that companies would rather lower production than sell at a loss; #''Intermediate range'', |
You cannot overwrite this file.
File usage on Commons
There are no pages that use this file.
File usage on other wikis
The following other wikis use this file:
- Usage on es.wikipedia.org