File:A View Inside Typhoon Atsani.jpg
Original file (720 × 720 pixels, file size: 64 KB, MIME type: image/jpeg)
Captions
Captions
Summary
[edit]
| Description |
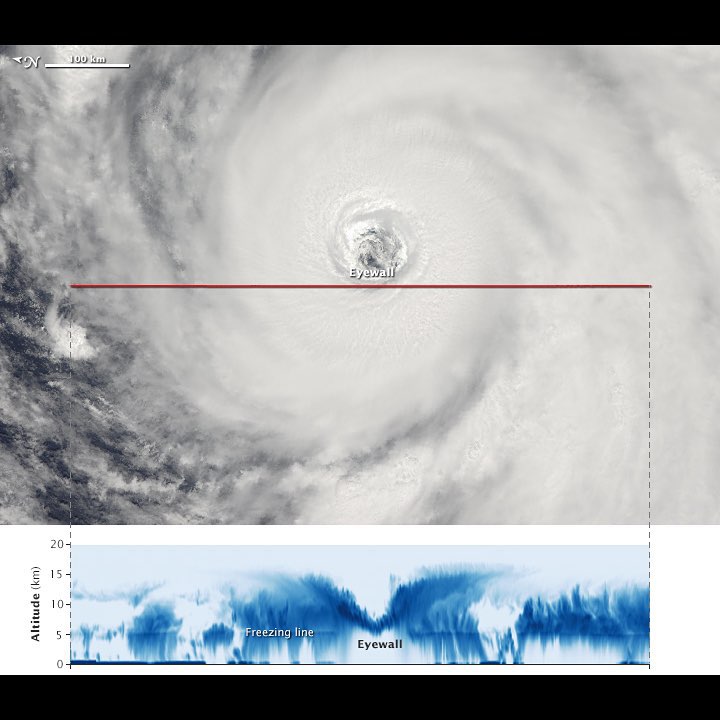
English: While it has been a quiet hurricane season in the Atlantic Basin, the western North Pacific has been churning out typhoons on a near weekly basis. One of the most recent to emerge—Atsani—achieved super typhoon status (equivalent of a Category 4 or 5 storm) earlier this week as it churned over the Pacific well northeast of Guam and Saipan.
Atsani was the twelfth typhoon and sixth super typhoon of the year in the western North Pacific—numbers that meteorologists say put the season on a record-breaking track. While the storm will likely curve northeast in the coming days and miss Japan, it remains of interest to atmospheric scientists studying the inner workings of typhoons. Shortly before Atsani became a super typhoon on August 19, 2015, CloudSat passed near its eye and used cloud-penetrating radar to collect information about the inside of the storm. The CloudSat data (lower image) is a cross-section—it shows what the storm would look like if it had been sliced near the middle and viewed from the side. The top image, acquired the same day by the Moderate Resolution Imaging Spectroradiometer (MODIS) on the Aqua satellite, is shown for reference. The red line is the north-to-south track that CloudSat took over the storm. Note that the storm image has been rotated. In the CloudSat data, the darkest blues represent areas where clouds and raindrops reflected the strongest signal back to the satellite radar. These areas had the heaviest precipitation and the largest water droplets. The blue horizontal line across the data is the freezing line; ice particles formed above it, raindrops below it. CloudSat passed just west of the eye, offering a good view of the storm’s outward sloping eyewall, intense convection and rainfall, and cloud structure. Atsani’s clouds reached about 16 kilometers (10 miles) altitude at their highest point. When CloudSat imaged the storm, Atsani’s maximum sustained winds were about 150 miles (240 kilometers) per hour. Download full resolution and read more at earthobservatory.nasa.gov/IOTD/view.php?id=86454&src=...
|
| Date | |
| Source | https://www.flickr.com/photos/68824346@N02/20753414042/ |
| Author | NASA Earth Observatory |
Licensing
[edit]
- You are free:
- to share – to copy, distribute and transmit the work
- to remix – to adapt the work
- Under the following conditions:
- attribution – You must give appropriate credit, provide a link to the license, and indicate if changes were made. You may do so in any reasonable manner, but not in any way that suggests the licensor endorses you or your use.
| This image was originally posted to Flickr by NASA Earth Observatory at https://flickr.com/photos/68824346@N02/20753414042. It was reviewed on 25 October 2020 by FlickreviewR 2 and was confirmed to be licensed under the terms of the cc-by-2.0. |
File history
Click on a date/time to view the file as it appeared at that time.
| Date/Time | Thumbnail | Dimensions | User | Comment | |
|---|---|---|---|---|---|
| current | 12:38, 25 October 2020 | | 720 × 720 (64 KB) | Kroger4 (talk | contribs) | Uploaded a work by NASA Earth Observatory from https://www.flickr.com/photos/68824346@N02/20753414042/ with UploadWizard |
You cannot overwrite this file.
File usage on Commons
There are no pages that use this file.