File:2022 NHC EP152022 5day cone no line and wind.png
Jump to navigation
Jump to search

Size of this preview: 731 × 600 pixels. Other resolutions: 293 × 240 pixels | 585 × 480 pixels | 897 × 736 pixels.
Original file (897 × 736 pixels, file size: 53 KB, MIME type: image/png)
Captions
Captions
Add a one-line explanation of what this file represents
Summary
[edit]
| Description |
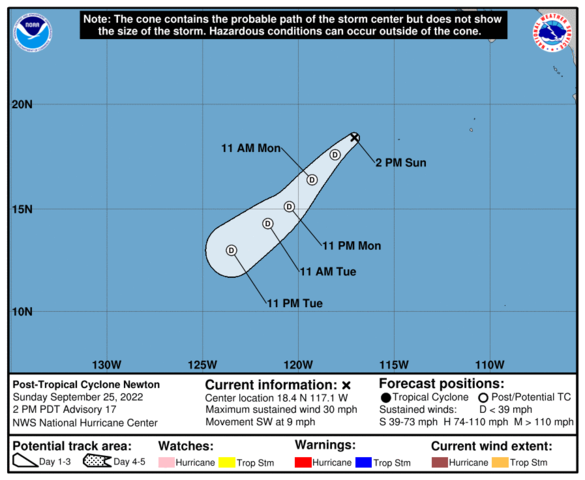
English: National Hurricane Center's 5-day track and intensity forecast cone of Eastern North Pacific EP152022 Post-Tropical Cyclone Newton. |
| Date | |
| Source | https://www.nhc.noaa.gov/refresh/graphics_ep5+shtml/204355.shtml?cone#contents |
| Author | National Hurricane Center |
Licensing
[edit]
This image is in the public domain because it contains materials that originally came from the U.S. National Oceanic and Atmospheric Administration, taken or made as part of an employee's official duties.
|
File history
Click on a date/time to view the file as it appeared at that time.
| Date/Time | Thumbnail | Dimensions | User | Comment | |
|---|---|---|---|---|---|
| current | 21:06, 25 September 2022 | | 897 × 736 (53 KB) | Cewbot (talk | contribs) | Import NHC tropical cyclone forecast map of Eastern North Pacific EP152022 Post-Tropical Cyclone Newton Location: 18.4°N 117.1°W. Moving: SW at 9 mph. Min pressure: 1008 mb. Max sustained: 30 mph. https://www.nhc.noaa.gov/storm_graphics/EP15/refresh/EP152022_5day_cone_no_line_and_wind+png/204355_5day_cone_no_line_and_wind.png (2022-09-25 21:00 UTC) |
| 15:06, 25 September 2022 |  | 897 × 736 (56 KB) | Cewbot (talk | contribs) | Import NHC tropical cyclone forecast map of Eastern North Pacific EP152022 Tropical Depression Newton Location: 19.0°N 116.4°W. Moving: WSW at 9 mph. Min pressure: 1008 mb. Max sustained: 35 mph. https://www.nhc.noaa.gov/storm_graphics/EP15/refresh/EP152022_5day_cone_no_line_and_wind+png/142950_5day_cone_no_line_and_wind.png (2022-09-25 15:00 UTC) | |
| 09:06, 25 September 2022 |  | 897 × 736 (58 KB) | Cewbot (talk | contribs) | Import NHC tropical cyclone forecast map of Eastern North Pacific EP152022 Tropical Depression Newton Location: 19.4°N 115.6°W. Moving: W at 8 mph. Min pressure: 1006 mb. Max sustained: 35 mph. https://www.nhc.noaa.gov/storm_graphics/EP15/refresh/EP152022_5day_cone_no_line_and_wind+png/084635_5day_cone_no_line_and_wind.png (2022-09-25 09:00 UTC) | |
| 03:06, 25 September 2022 |  | 897 × 736 (55 KB) | Cewbot (talk | contribs) | Import NHC tropical cyclone forecast map of Eastern North Pacific EP152022 Tropical Depression Newton Location: 19.5°N 114.8°W. Moving: W at 8 mph. Min pressure: 1006 mb. Max sustained: 35 mph. https://www.nhc.noaa.gov/storm_graphics/EP15/refresh/EP152022_5day_cone_no_line_and_wind+png/023511_5day_cone_no_line_and_wind.png (2022-09-25 00:00 UTC) | |
| 21:06, 24 September 2022 |  | 897 × 736 (55 KB) | Cewbot (talk | contribs) | Import NHC tropical cyclone forecast map of Eastern North Pacific EP152022 Tropical Depression Newton Location: 19.4°N 113.9°W. Moving: W at 9 mph. Min pressure: 1005 mb. Max sustained: 35 mph. https://www.nhc.noaa.gov/storm_graphics/EP15/refresh/EP152022_5day_cone_no_line_and_wind+png/204807_5day_cone_no_line_and_wind.png (2022-09-24 18:00 UTC) | |
| 15:06, 24 September 2022 |  | 897 × 736 (54 KB) | Cewbot (talk | contribs) | Import NHC tropical cyclone forecast map of Eastern North Pacific EP152022 Tropical Storm Newton Location: 19.1°N 113.2°W. Moving: WNW at 8 mph. Min pressure: 1004 mb. Max sustained: 40 mph. https://www.nhc.noaa.gov/storm_graphics/EP15/refresh/EP152022_5day_cone_no_line_and_wind+png/145039_5day_cone_no_line_and_wind.png (2022-09-24 12:00 UTC) | |
| 09:06, 24 September 2022 |  | 897 × 736 (53 KB) | Cewbot (talk | contribs) | Import NHC tropical cyclone forecast map of Eastern North Pacific EP152022 Tropical Storm Newton Location: 18.9°N 112.4°W. Moving: WNW at 9 mph. Min pressure: 1004 mb. Max sustained: 40 mph. https://www.nhc.noaa.gov/storm_graphics/EP15/refresh/EP152022_5day_cone_no_line_and_wind+png/084705_5day_cone_no_line_and_wind.png (2022-09-24 06:00 UTC) | |
| 03:32, 24 September 2022 |  | 897 × 736 (55 KB) | Cewbot (talk | contribs) | Import NHC tropical cyclone forecast map of Eastern North Pacific EP152022 Tropical Storm Newton Location: 18.6°N 111.9°W. Moving: WNW at 9 mph. Min pressure: 1003 mb. Max sustained: 45 mph. https://www.nhc.noaa.gov/storm_graphics/EP15/refresh/EP152022_5day_cone_no_line_and_wind+png/032236_5day_cone_no_line_and_wind.png (2022-09-24 00:00 UTC) | |
| 22:32, 23 September 2022 |  | 897 × 736 (54 KB) | Cewbot (talk | contribs) | Import NHC tropical cyclone forecast map of Eastern North Pacific EP152022 Tropical Storm Newton Location: 18.2°N 111.3°W. Moving: WNW at 10 mph. Min pressure: 1003 mb. Max sustained: 45 mph. https://www.nhc.noaa.gov/storm_graphics/EP15/refresh/EP152022_5day_cone_no_line_and_wind+png/204059_5day_cone_no_line_and_wind.png (2022-09-23 18:00 UTC) | |
| 15:05, 23 September 2022 |  | 897 × 736 (61 KB) | Cewbot (talk | contribs) | Import NHC tropical cyclone forecast map of Eastern North Pacific EP152022 Tropical Storm Newton Location: 18.4°N 110.9°W. Moving: WNW at 7 mph. Min pressure: 1000 mb. Max sustained: 50 mph. https://www.nhc.noaa.gov/storm_graphics/EP15/refresh/EP152022_5day_cone_no_line_and_wind+png/145056_5day_cone_no_line_and_wind.png (2022-09-23 12:00 UTC) |
You cannot overwrite this file.
File usage on Commons
There are no pages that use this file.