File:1panel ghgs obs nh nrm.1.png
Jump to navigation
Jump to search
No higher resolution available.
1panel_ghgs_obs_nh_nrm.1.png (502 × 498 pixels, file size: 12 KB, MIME type: image/png)
Captions
Captions
Add a one-line explanation of what this file represents
Summary
[edit]
| Description |
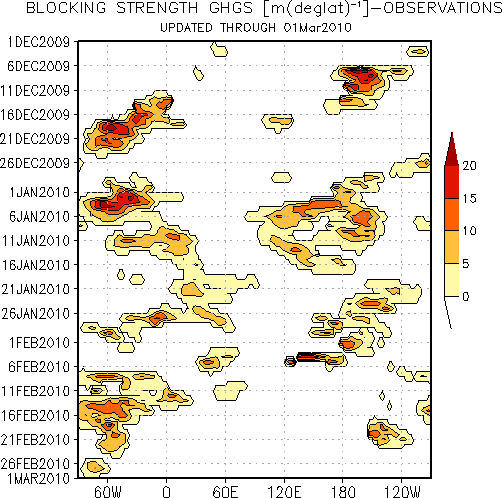
English: All colored regions in the Hovmöller plot depict regions where the flow is blocked according to the blocking index. [1] The color scheme denotes the strength of the blocked flow.
Français : Toutes les régions de couleur dans la représentation de Hovmöller indiquent les régions où le flux est bloqué d'après l'indice de blocage. Le jeu de couleurs représente la force du flux bloqué. |
| Source | http://www.cpc.noaa.gov/products/precip/CWlink/MJO/block.shtml |
| Author | Climate Prediction Center |
Il sera updaté début mars
Licensing
[edit]
This image is in the public domain because it contains materials that originally came from the U.S. National Oceanic and Atmospheric Administration, taken or made as part of an employee's official duties.
|
File history
Click on a date/time to view the file as it appeared at that time.
| Date/Time | Thumbnail | Dimensions | User | Comment | |
|---|---|---|---|---|---|
| current | 21:30, 1 March 2010 | | 502 × 498 (12 KB) | Arh'lupia (talk | contribs) | {{en}} Update {{fr}} Mise à jour |
| 20:57, 18 February 2010 |  | 503 × 498 (11 KB) | Arh'lupia (talk | contribs) | {{Information |Description={{en|1=All colored regions in the Hovmöller plot depict regions where the flow is blocked according to the blocking index. The color scheme denote |
You cannot overwrite this file.
File usage on Commons
The following page uses this file:
- File:1panel ghgs obs nh nrm.gif (file redirect)
File usage on other wikis
The following other wikis use this file:
- Usage on de.wikipedia.org
- Usage on fr.wikipedia.org
- Usage on it.wikipedia.org
- Usage on nl.wikipedia.org