File:1973-75 recession.jpg
Jump to navigation
Jump to search
No higher resolution available.
1973-75_recession.jpg (484 × 292 pixels, file size: 23 KB, MIME type: image/jpeg)
Captions
Captions
Add a one-line explanation of what this file represents
Summary
[edit]| Description |
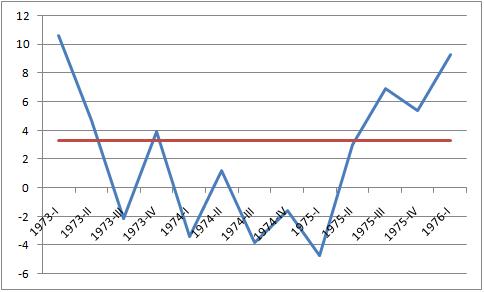
English: A graph of the recession in the United States from 1973-75.
|
||
| Date | |||
| Source | Own work | ||
| Author | JayHenry | ||
| Permission (Reusing this file) |
|

|
This graph image could be re-created using vector graphics as an SVG file. This has several advantages; see Commons:Media for cleanup for more information. If an SVG form of this image is available, please upload it and afterwards replace this template with
{{vector version available|new image name}}.
It is recommended to name the SVG file “1973-75 recession.svg”—then the template Vector version available (or Vva) does not need the new image name parameter. |


Licensing
[edit]
| I, the copyright holder of this work, release this work into the public domain. This applies worldwide. In some countries this may not be legally possible; if so: I grant anyone the right to use this work for any purpose, without any conditions, unless such conditions are required by law. |
File history
Click on a date/time to view the file as it appeared at that time.
| Date/Time | Thumbnail | Dimensions | User | Comment | |
|---|---|---|---|---|---|
| current | 03:26, 27 July 2009 | | 484 × 292 (23 KB) | JayHenry (talk | contribs) | {{Information |Description={{en|1=A graph of the recession in the United States from 1973-75. *Blue line is Percent Change From Preceding Period in Real Gross Domestic Product (annualized; seasonally adjusted) * Red line is Average GDP growth 1947–2009 |
You cannot overwrite this file.
File usage on Commons
There are no pages that use this file.
File usage on other wikis
The following other wikis use this file:
- Usage on el.wikipedia.org
- Usage on en.wikipedia.org
- Usage on es.wikipedia.org
- Usage on fr.wikipedia.org
- Usage on ja.wikipedia.org
- Usage on nl.wikipedia.org
- Usage on no.wikipedia.org
- Usage on simple.wikipedia.org
- Usage on vi.wikipedia.org
- Usage on zh.wikipedia.org