File:1941 Atlantic hurricane season summary map.png
Jump to navigation
Jump to search

Size of this preview: 600 × 600 pixels. Other resolutions: 240 × 240 pixels | 480 × 480 pixels | 768 × 768 pixels | 1,024 × 1,024 pixels | 2,048 × 2,048 pixels | 3,000 × 3,000 pixels.
Original file (3,000 × 3,000 pixels, file size: 5.35 MB, MIME type: image/png)
Captions
Captions
Add a one-line explanation of what this file represents
| Description |
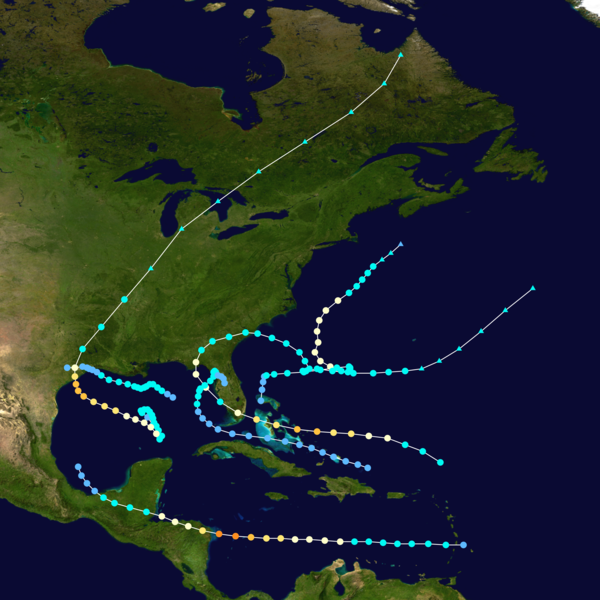
English: This map shows the tracks of all tropical cyclones in the 1941 Atlantic hurricane season. The points show the location of each storm at 6-hour intervals. The colour represents the storm's maximum sustained wind speeds as classified in the Saffir-Simpson Hurricane Scale (see below), and the shape of the data points represent the type of the storm.
Tropical depression (≤38 mph, ≤62 km/h)
Tropical storm (39–73 mph, 63–118 km/h)
Category 1 (74–95 mph, 119–153 km/h)
Category 2 (96–110 mph, 154–177 km/h)
Category 3 (111–129 mph, 178–208 km/h)
Category 4 (130–156 mph, 209–251 km/h)
Category 5 (≥157 mph, ≥252 km/h)
Unknown
Storm type |
| Source | Created using Wikipedia:WikiProject Tropical cyclones/Tracks. The background image is from NASA [1]. The tracking data is from the National Hurricane Center's Atlantic hurricane database |
| Author | Cyclonebiskit |
| This work has been released into the public domain by its author, Cyclonebiskit. This applies worldwide. In some countries this may not be legally possible; if so: Cyclonebiskit grants anyone the right to use this work for any purpose, without any conditions, unless such conditions are required by law. |
File history
Click on a date/time to view the file as it appeared at that time.
| Date/Time | Thumbnail | Dimensions | User | Comment | |
|---|---|---|---|---|---|
| current | 18:45, 4 June 2013 | | 3,000 × 3,000 (5.35 MB) | Cyclonebiskit (talk | contribs) | HURDAT update |
| 02:57, 24 November 2009 |  | 1,024 × 633 (500 KB) | Cyclonebiskit (talk | contribs) | complete tracks | |
| 15:57, 14 November 2009 |  | 1,024 × 789 (717 KB) | Cyclonebiskit (talk | contribs) | {{Information |Description={{en|Track map of 1941 Atlantic hurricane season. The points show the location of the storm at 6-hour intervals. The colour represents the storm's [[:w:maximum sustained wind|maximum sustaine |
You cannot overwrite this file.
File usage on Commons
The following page uses this file:
File usage on other wikis
The following other wikis use this file:
- Usage on en.wikipedia.org
- Usage on es.wikipedia.org
- Usage on fa.wikipedia.org
- Usage on fr.wikipedia.org
- Usage on nl.wikipedia.org
- Usage on vi.wikipedia.org
- Usage on www.wikidata.org
- Usage on zh.wikipedia.org
- Portal:美國/特色條目
- Portal:美國/優良條目
- Wikipedia:典范条目/2014年4月
- 1941年大西洋飓风季
- Talk:1941年大西洋飓风季
- Wikipedia:优良条目/2014年2月1日
- Wikipedia:优良条目/2014年2月
- Wikipedia:优良条目/1941年大西洋飓风季
- Portal:美国/优良条目/214
- Wikipedia:典范条目/2014年4月18日
- Wikipedia:典范条目/1941年大西洋飓风季
- Portal:美國/特色條目/112
- Wikipedia:典范条目/2015年12月
- Wikipedia:典范条目/2015年12月17日
- Wikipedia:典范条目/2018年3月
- Wikipedia:典范条目/2018年3月7日
- Wikipedia:典范条目/2021年7月
- Wikipedia:典范条目/2021年7月28日