File:日本における雇用形態別雇用者数の内訳 2008年 男性.png
Jump to navigation
Jump to search
No higher resolution available.
日本における雇用形態別雇用者数の内訳_2008年_男性.png (400 × 400 pixels, file size: 24 KB, MIME type: image/png)
Captions
Captions
Add a one-line explanation of what this file represents
| Description |
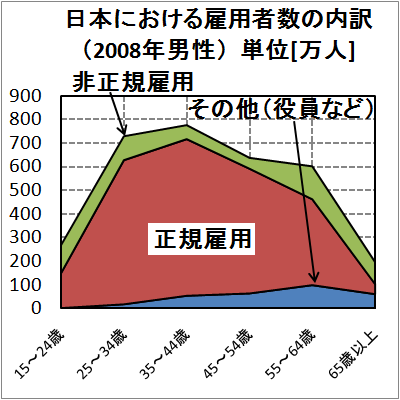
日本語: 積み上げグラフによる2008年の日本における雇用形態別男性雇用者数の内訳 |
||
| Date | |||
| Source | 総務省『労働力調査 長期時系列データ』 「表10:年齢階級,雇用形態別雇用者数」(平成20年平均値)を基に作成 | ||
| Author | ja:User:Yhiroyuki | ||
| Permission (Reusing this file) |
|
| その他(役員など)[1] | 正規雇用[2] | 非正規雇用[3] | |
|---|---|---|---|
| 15~24歳 | 1 | 149 | 119 |
| 25~34歳 | 17 | 610 | 101 |
| 35~44歳 | 53 | 663 | 59 |
| 45~54歳 | 63 | 528 | 46 |
| 55~64歳 | 98 | 364 | 139 |
| 65歳以上 | 60 | 44 | 93 |
File history
Click on a date/time to view the file as it appeared at that time.
| Date/Time | Thumbnail | Dimensions | User | Comment | |
|---|---|---|---|---|---|
| current | 11:07, 27 September 2009 | | 400 × 400 (24 KB) | Yhiroyuki (talk | contribs) | {{Information |Description= 積み上げグラフによる2008年の日本における雇用形態別男性雇用者数の内訳 |Source= 総務省『[http://www.stat.go.jp/data/roudou/longtime/03roudou.htm 労働力調査 長期時系列データ]』 |
You cannot overwrite this file.
File usage on Commons
There are no pages that use this file.