Category:SVG area charts
Jump to navigation
Jump to search
Media in category "SVG area charts"
The following 15 files are in this category, out of 15 total.
-
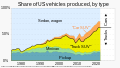 1975- US vehicle production share, by vehicle type.svg 1,200 × 675; 4 KB
-

-

-
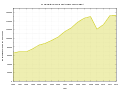
 8000 BCE+ Loss of forest and grassland to grazing and crops.svg 1,200 × 675; 3 KB
-
 Battle of Trafalgar Casualties.svg 1,326 × 784; 16 KB
-
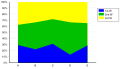 Charts SVG Example 12 - Stacked 100% Area Chart.svg 692 × 395; 6 KB
-
 Kombinierter Verkehr Eisenbahn und Binnenschifffahrt.svg 800 × 600; 32 KB
-
 Kombinierter Verkehr Schifffahrt.svg 800 × 600; 35 KB
-
 Moonrises sets and phases berlin 03 2018.svg 800 × 350; 73 KB
-
 MSCI EM (2020).svg 3,899 × 2,601; 28 KB
-
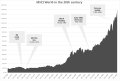 MSCI World 20th century.svg 3,900 × 2,601; 38 KB
-
 MSCI World Historie 1969 - 2020.svg 1,687 × 1,155; 81 KB
-
 MSCI World Price Index - History 1969 - 2020.svg 1,687 × 1,155; 77 KB
-
 Nuclear proliferation.svg 750 × 563; 79 KB
-
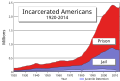 US incarceration timeline-clean.svg 693 × 464; 11 KB


.svg)


